
How can our children 'get' carbon?
How can we engage children in the climate crisis and the role played by carbon dioxide in a way that makes it personal and real? One option is to use the energy (and thus carbon) data of the school itself to provide insight and learning.
How can we engage children in the climate crisis and the role played by carbon dioxide in a way that makes it personal and real? One option is to use the energy (and thus carbon) data of the school itself to provide insight and learning.
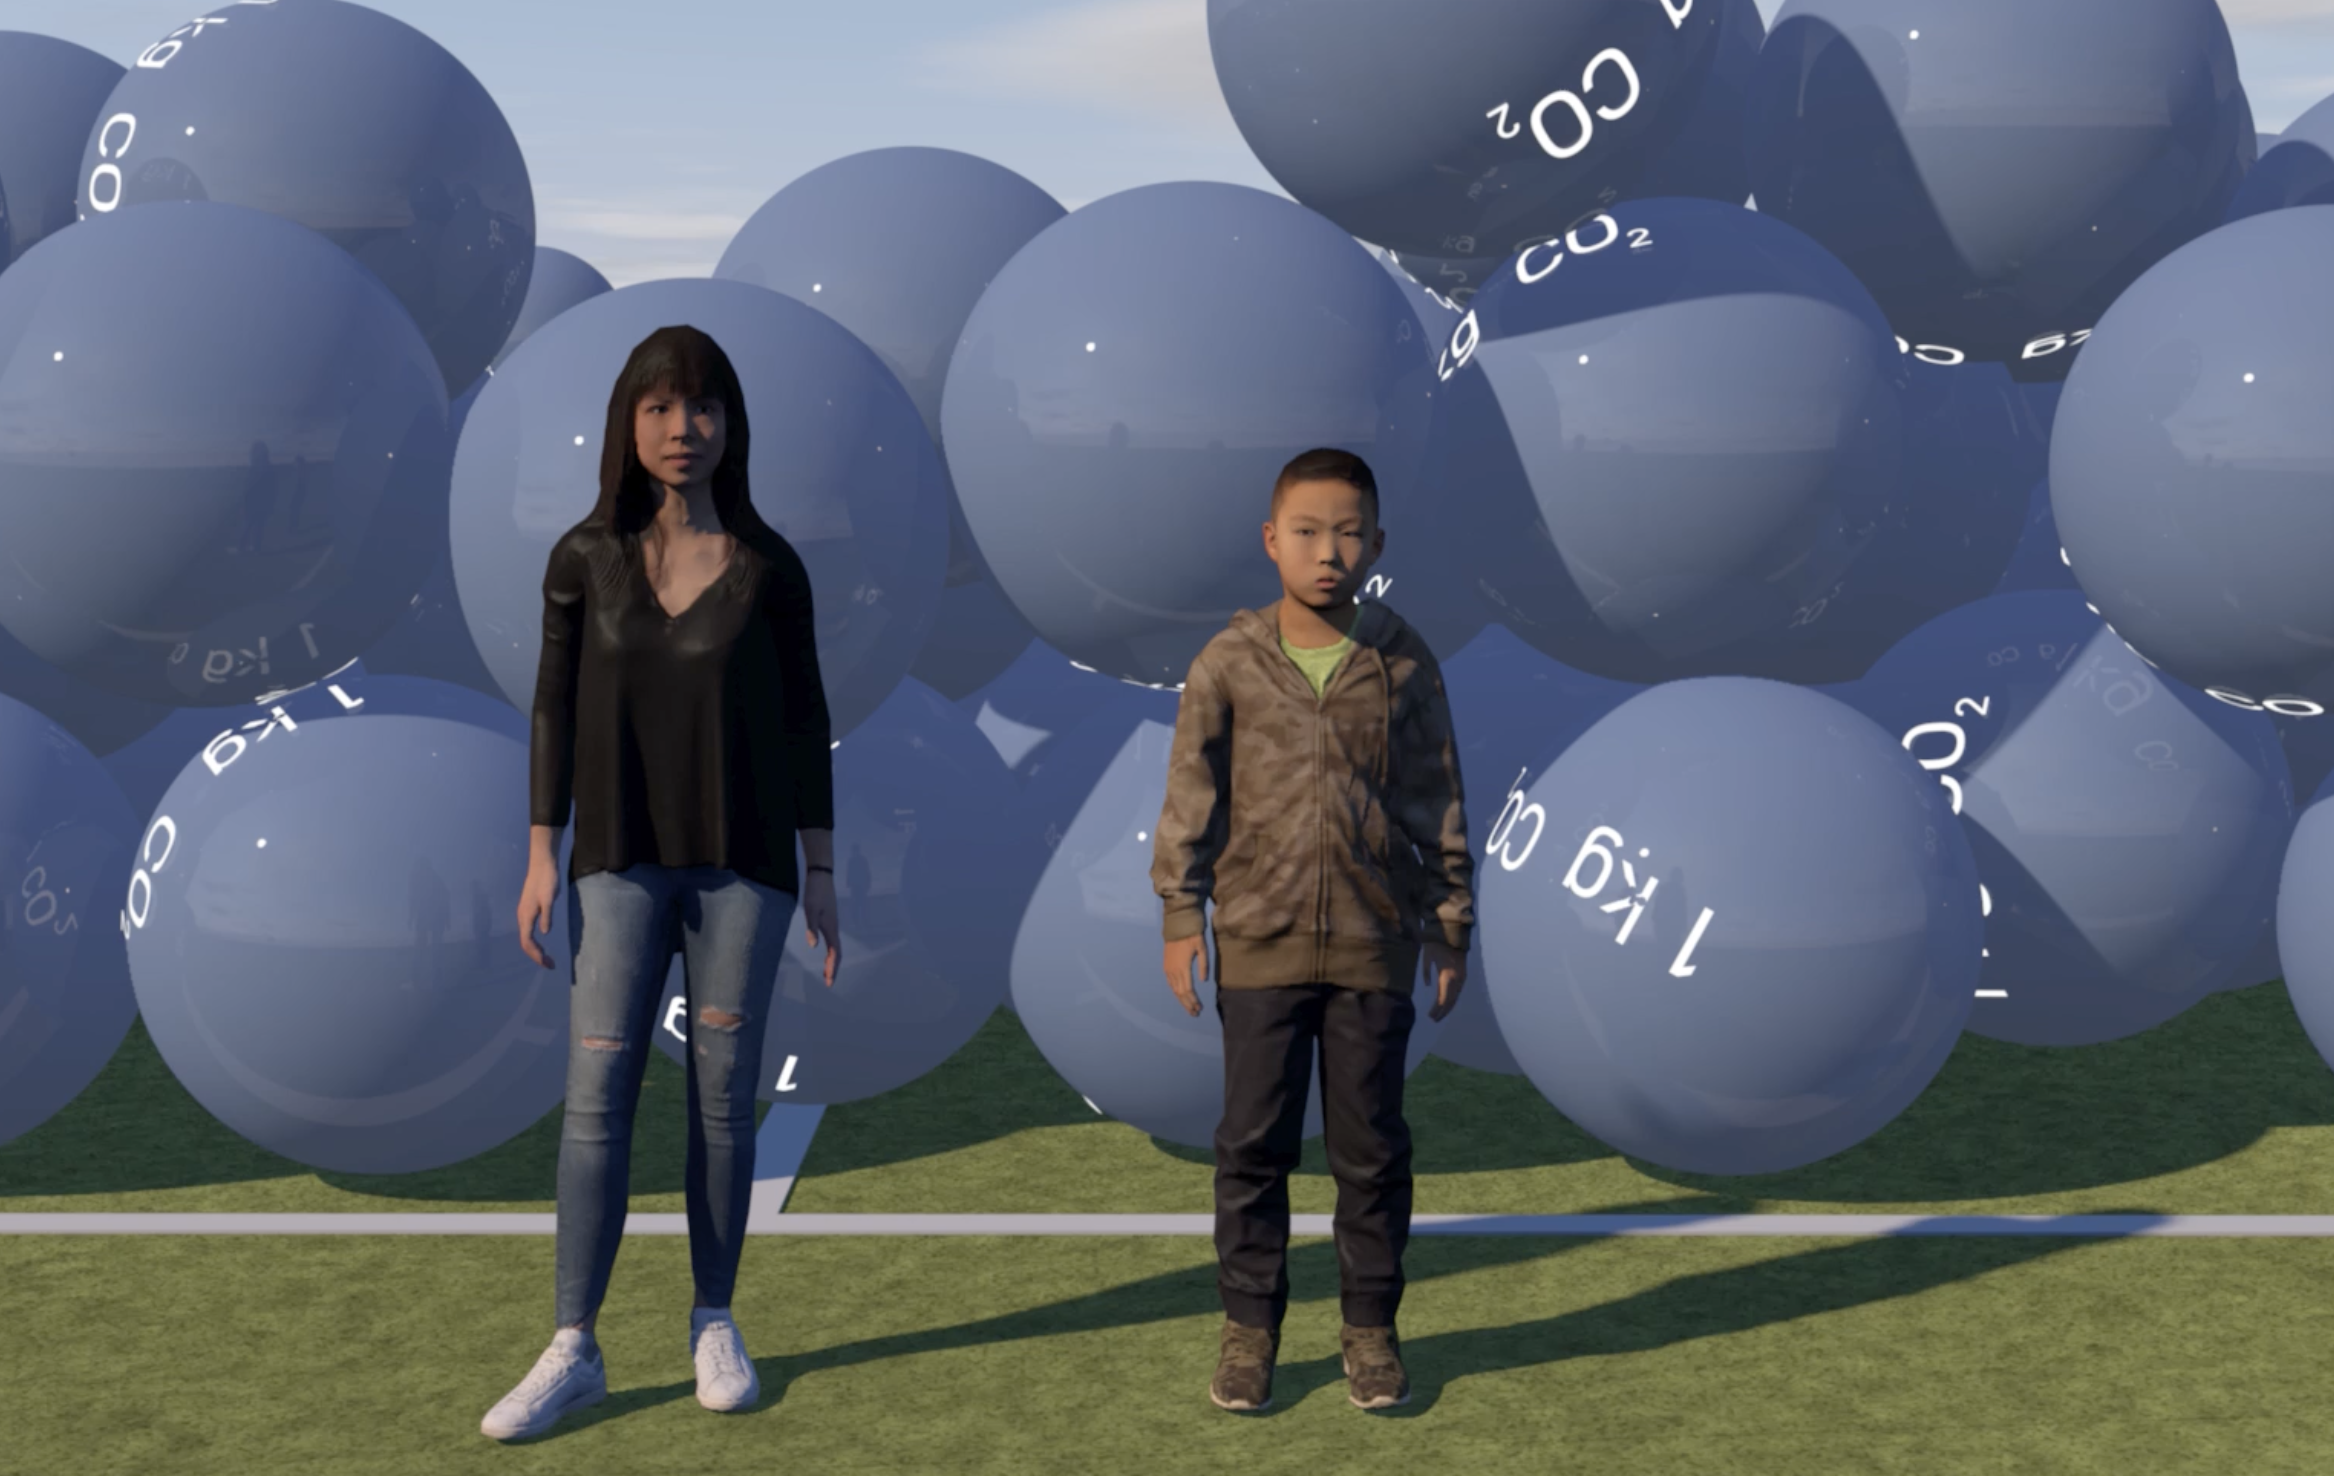
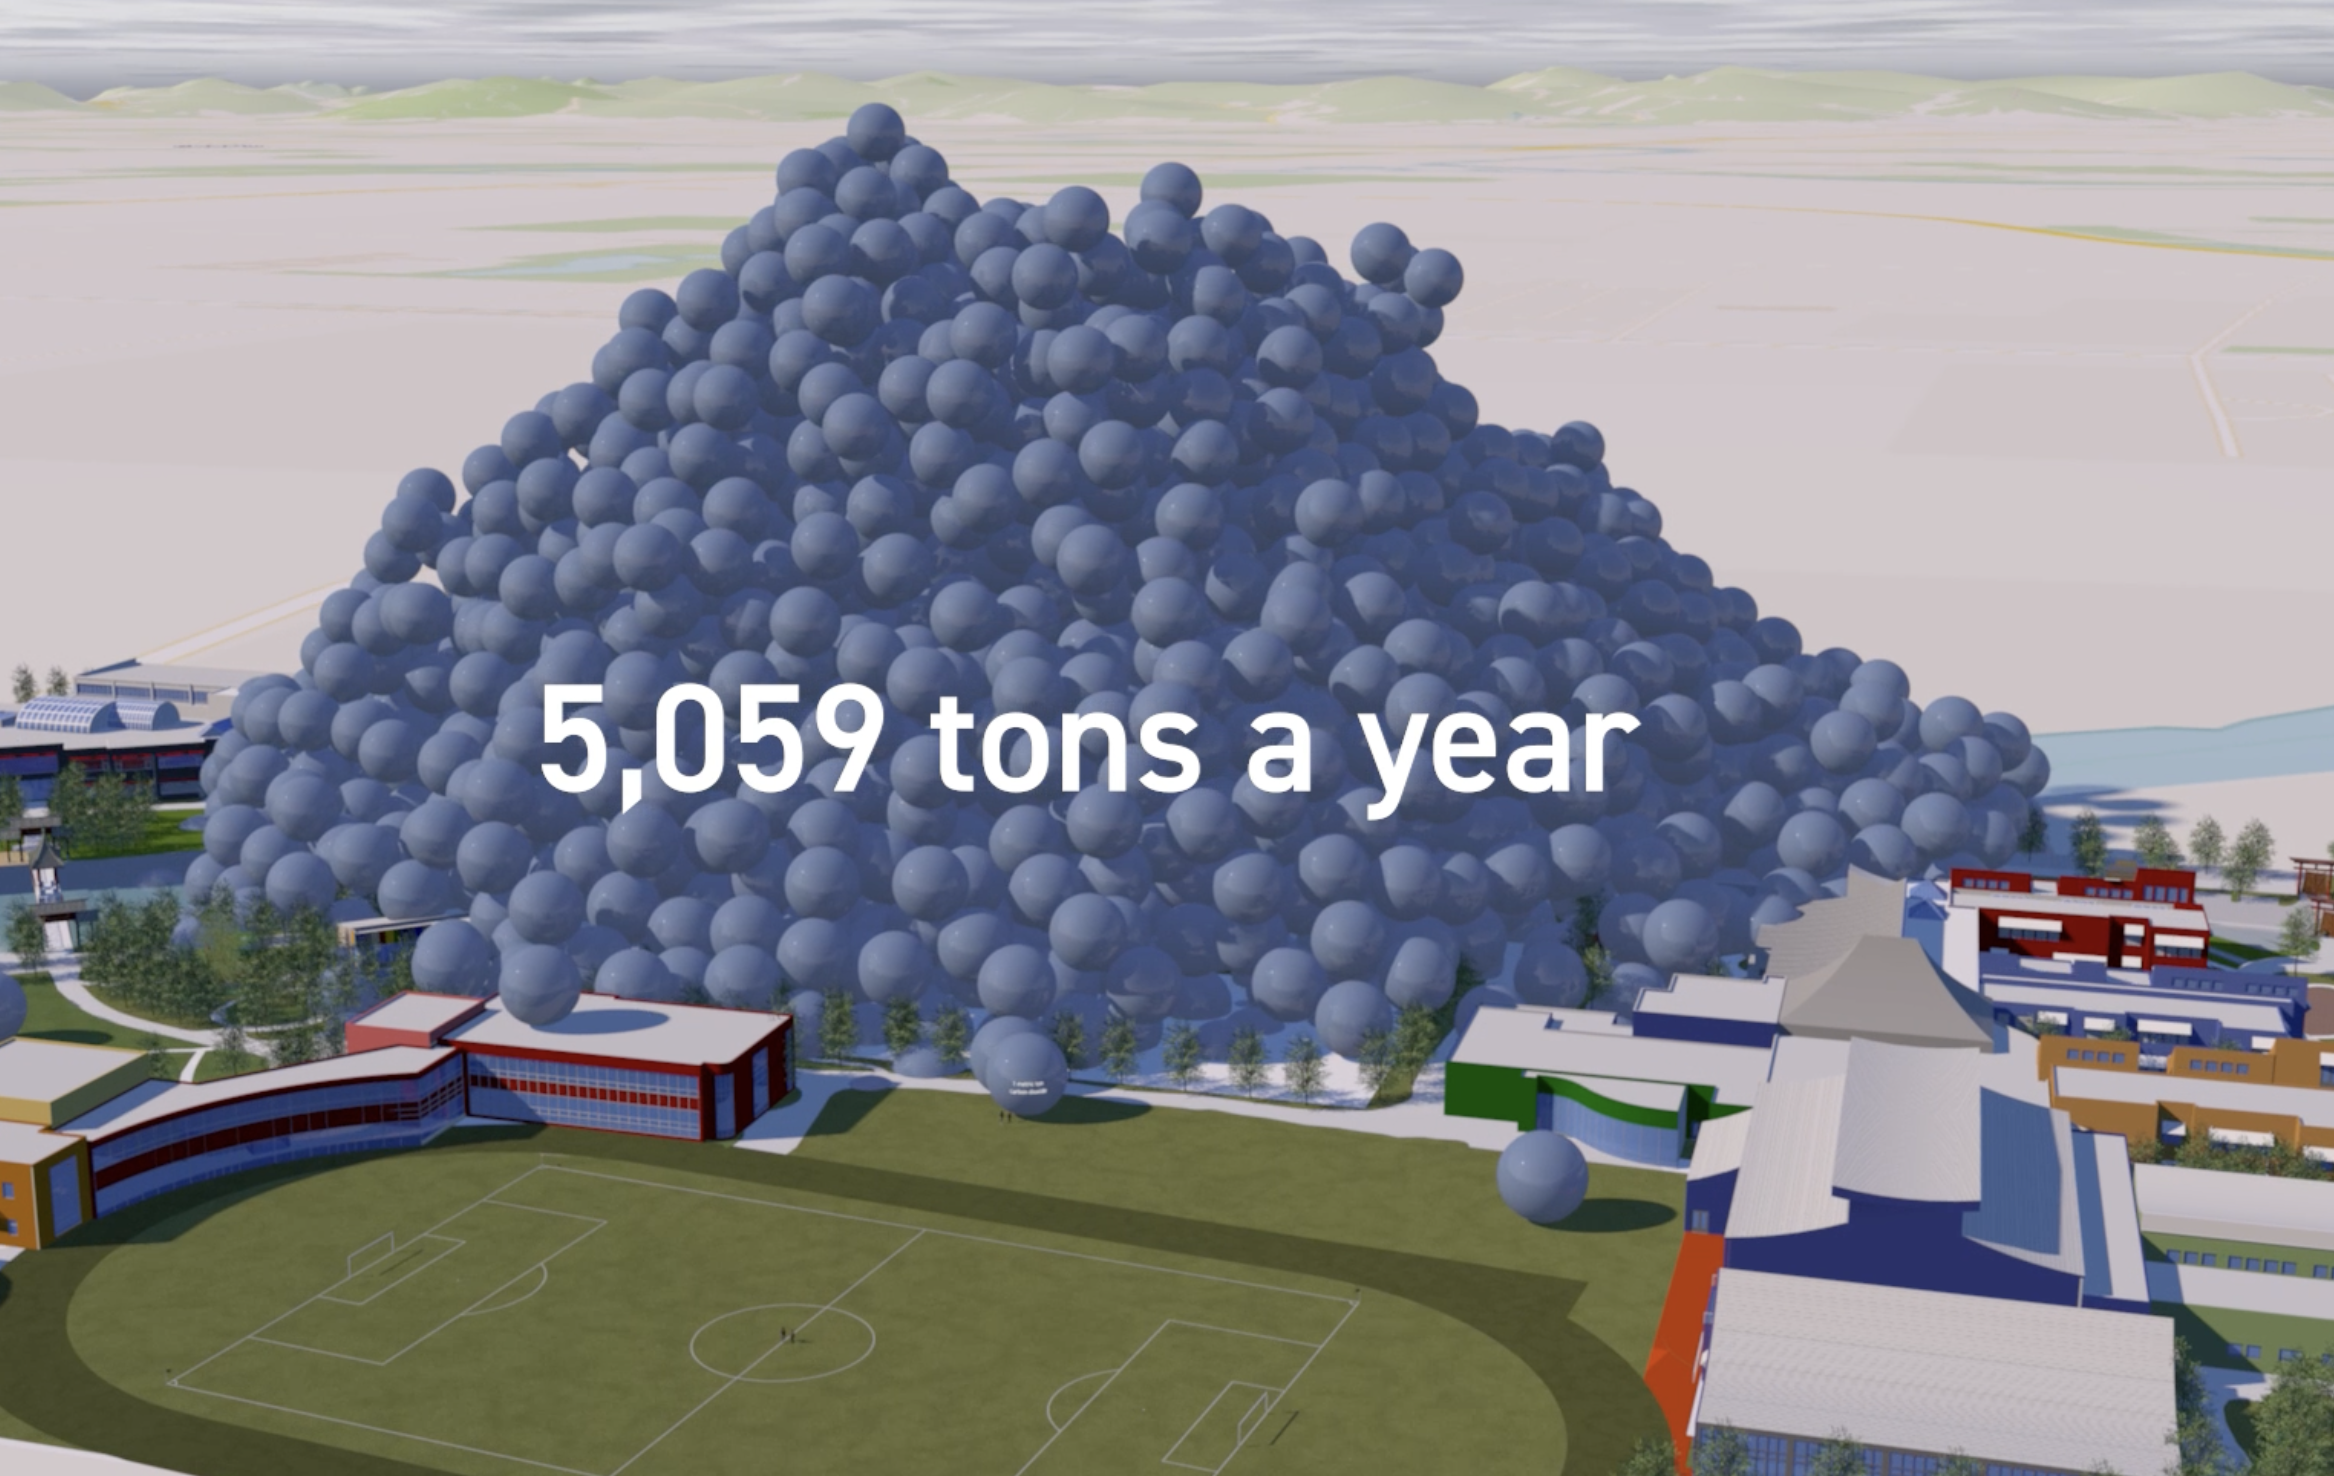
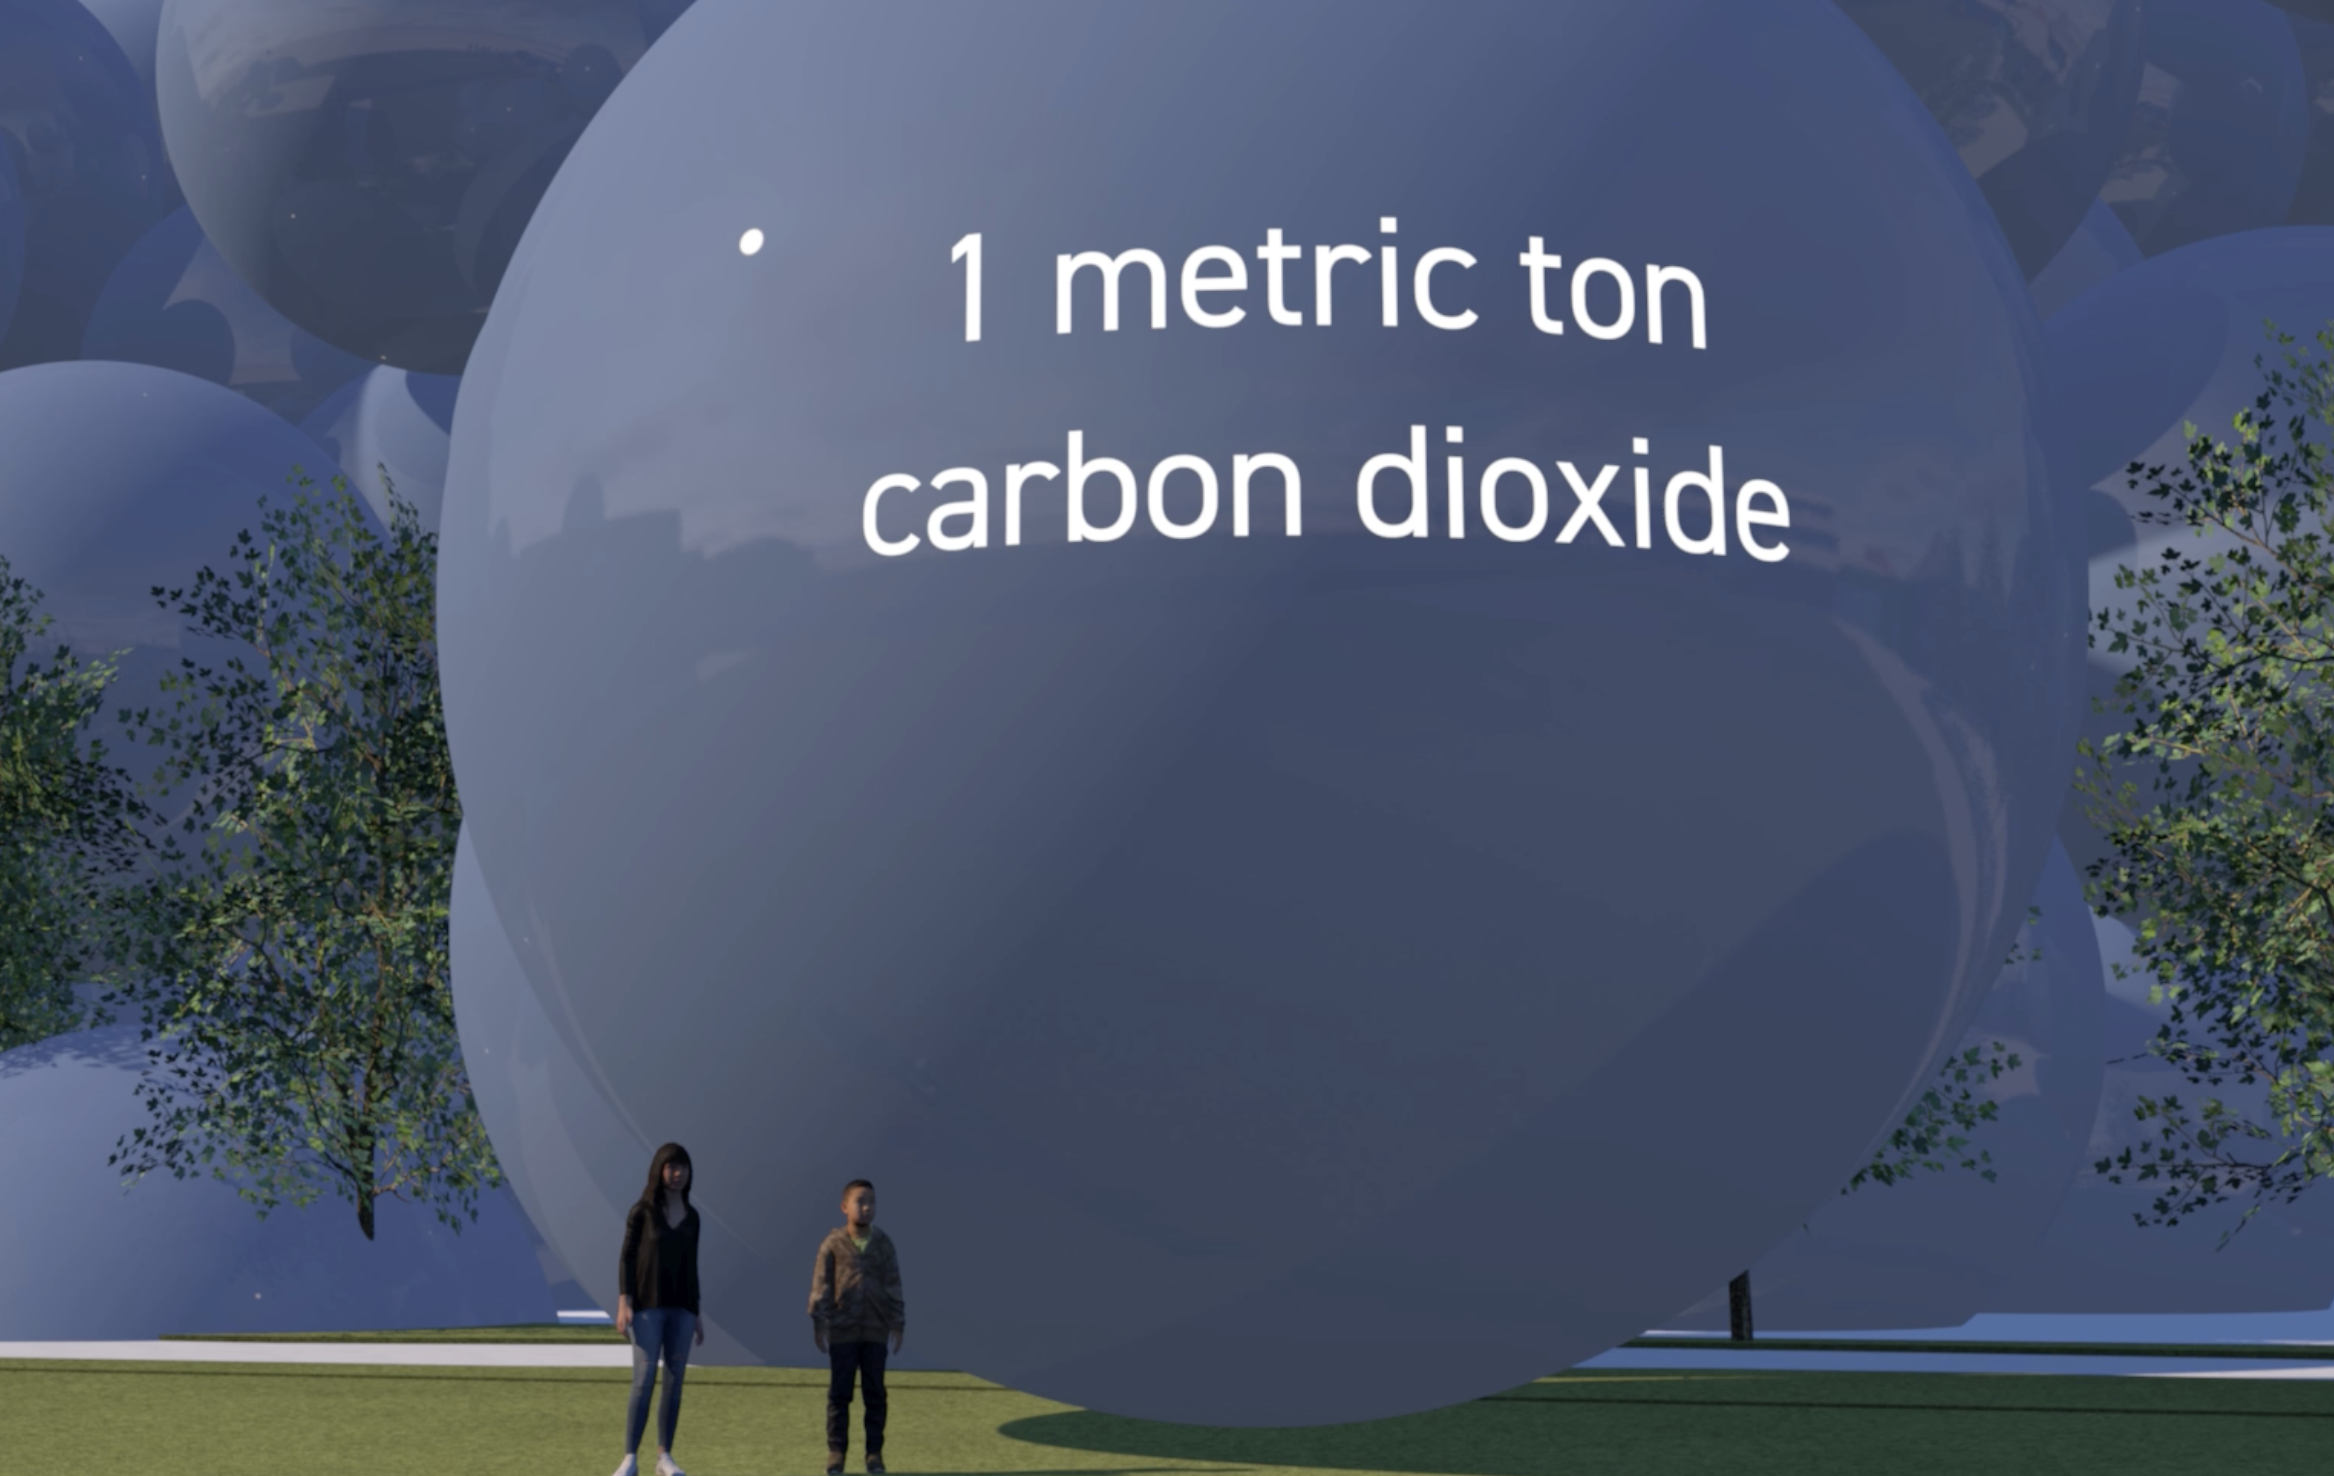
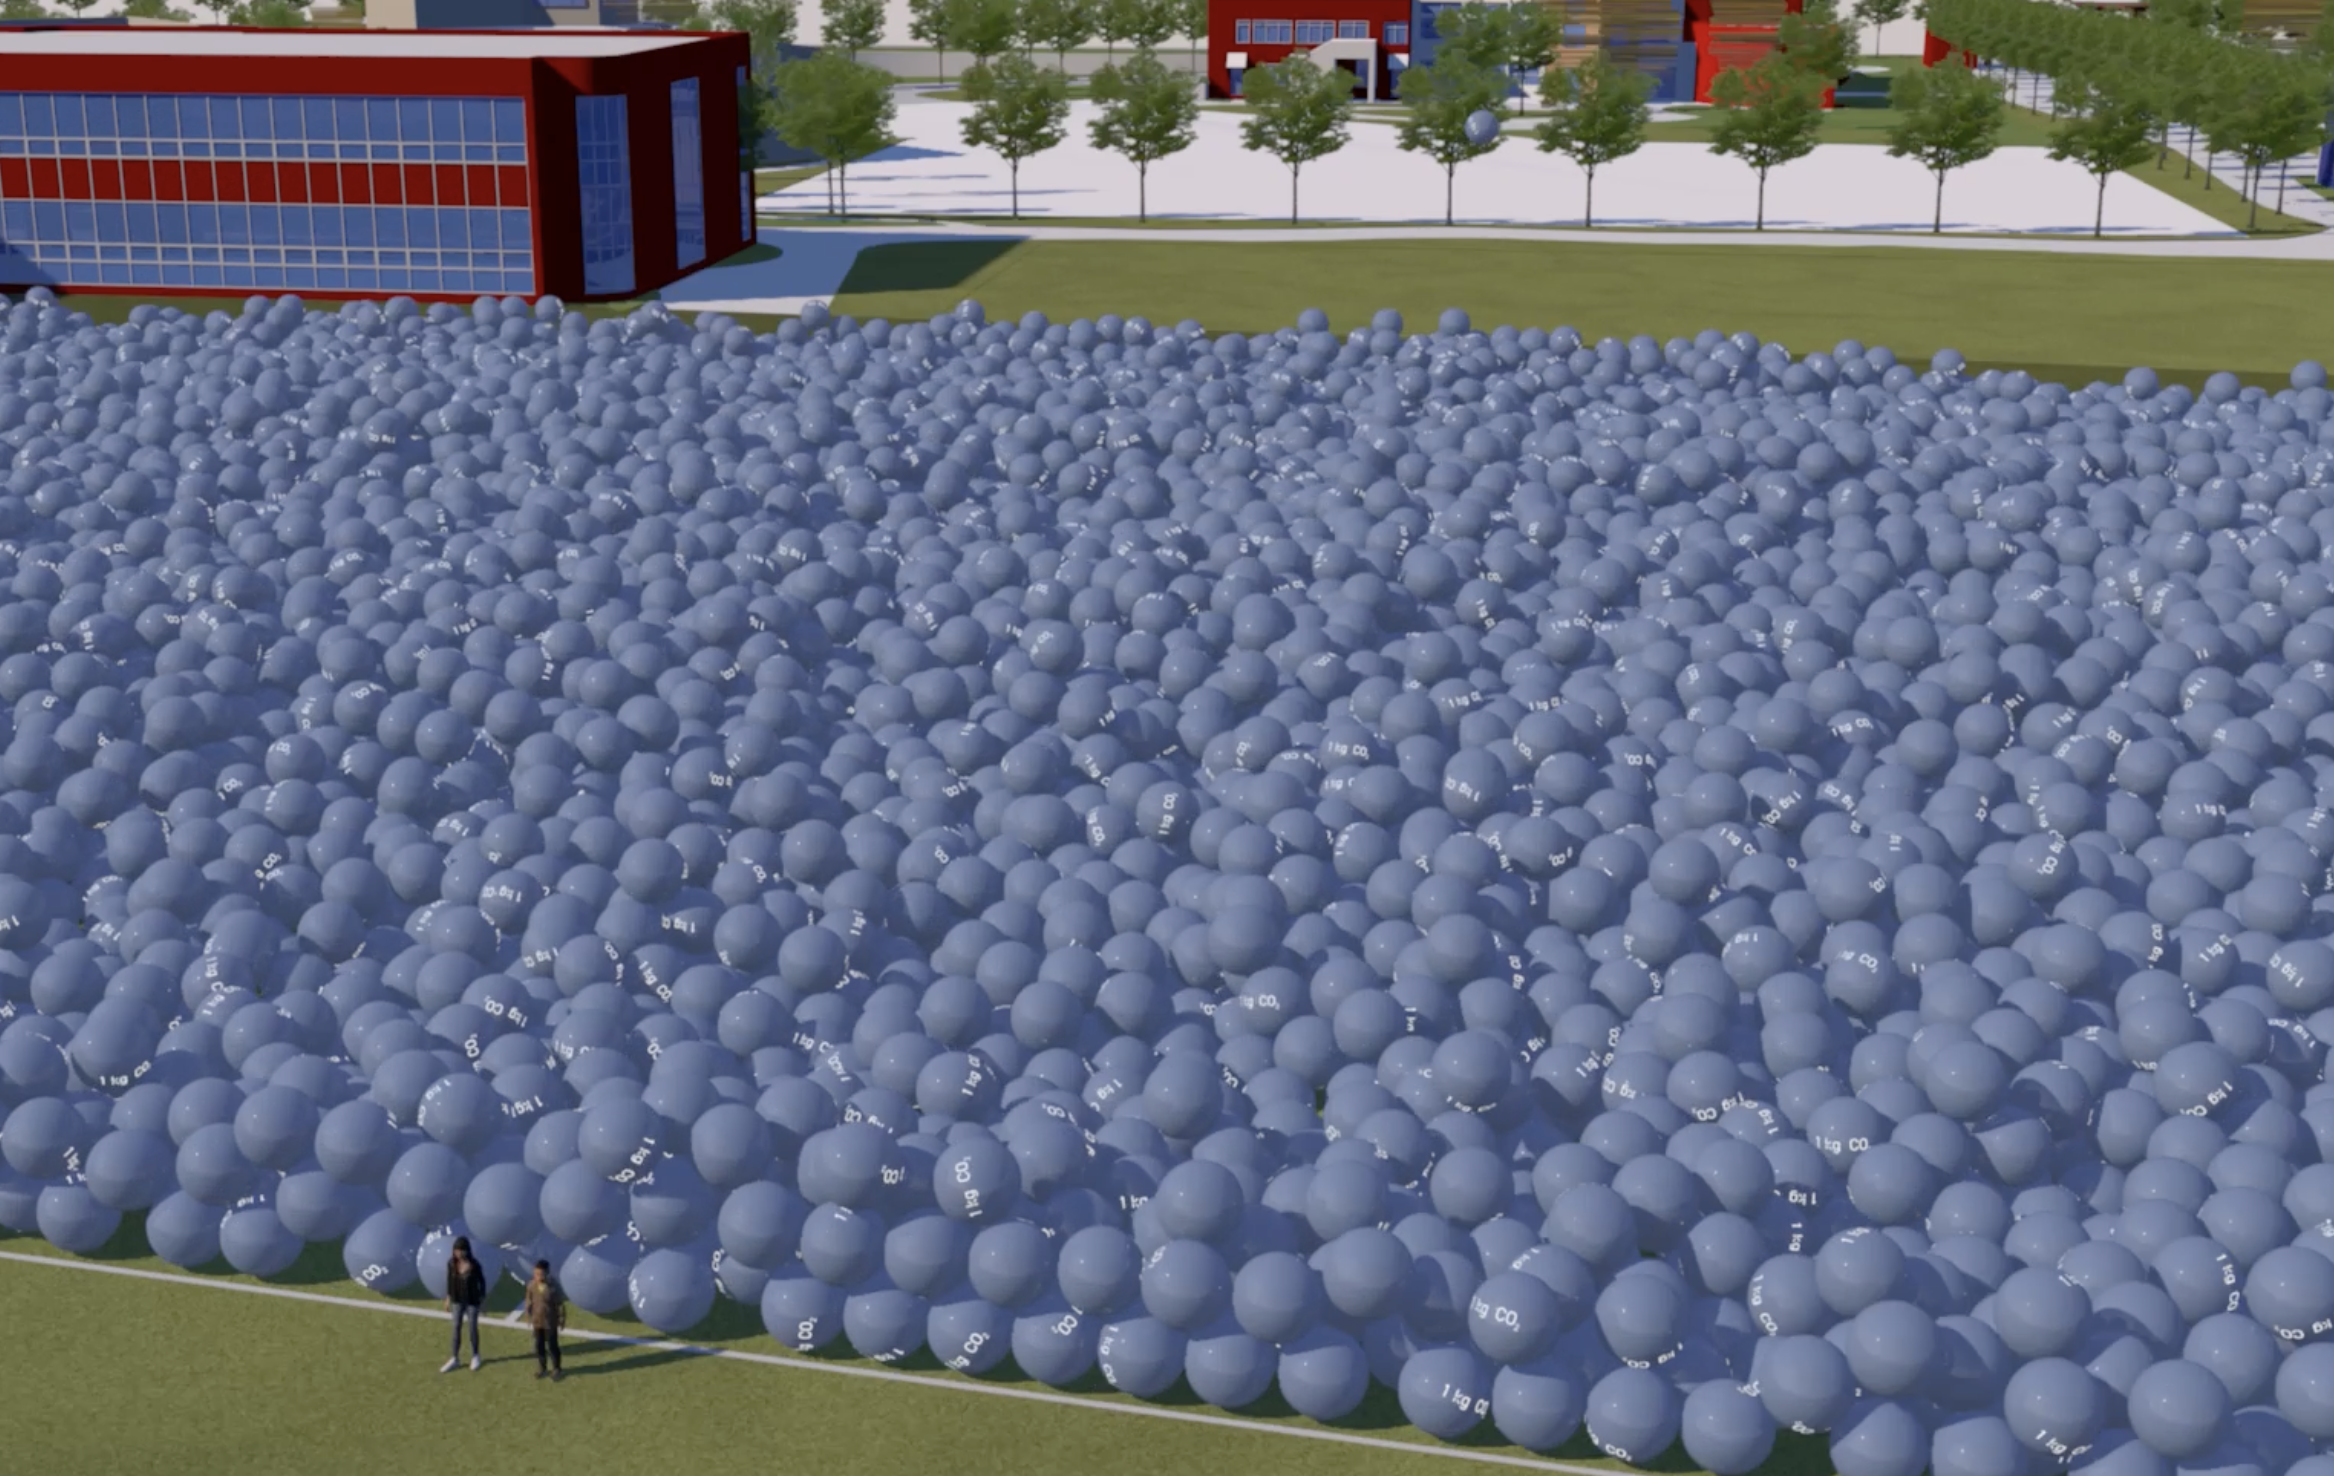
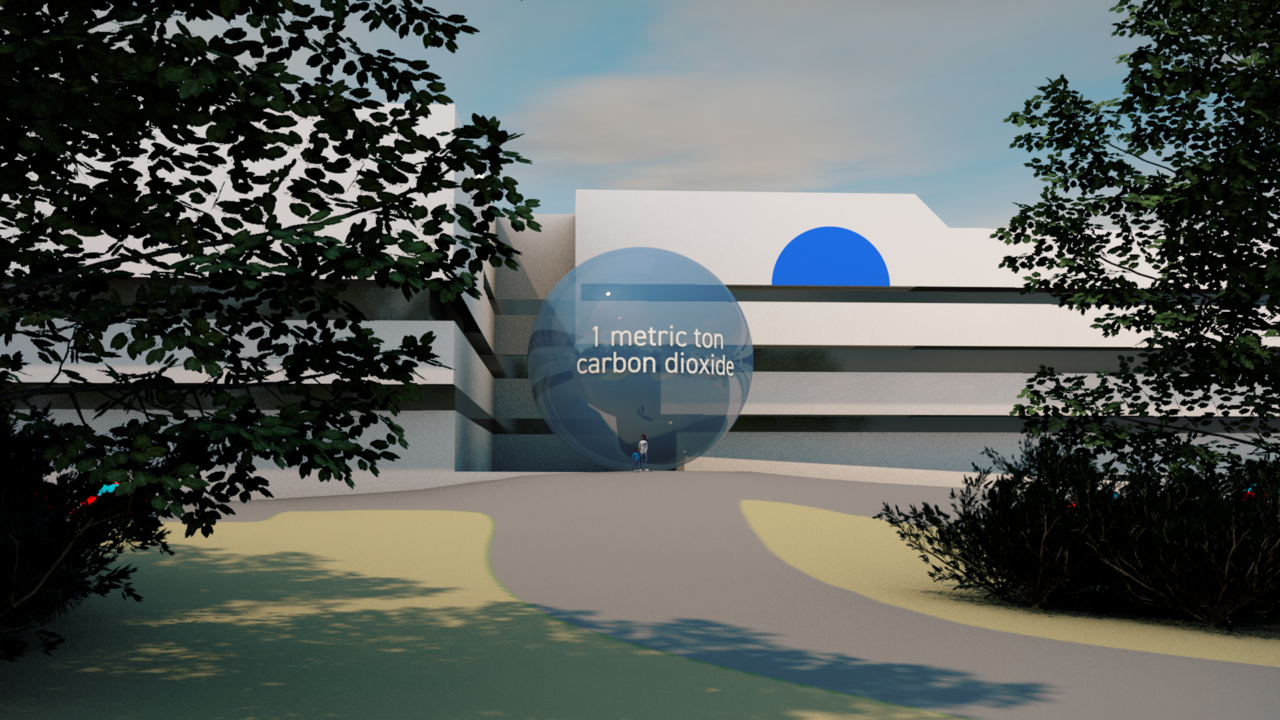
This was the intention of international education specialists Metanoia whose client, a school in mainland China, wanted to help children, teachers and staff engage with the ‘carbon story’ of their own school.
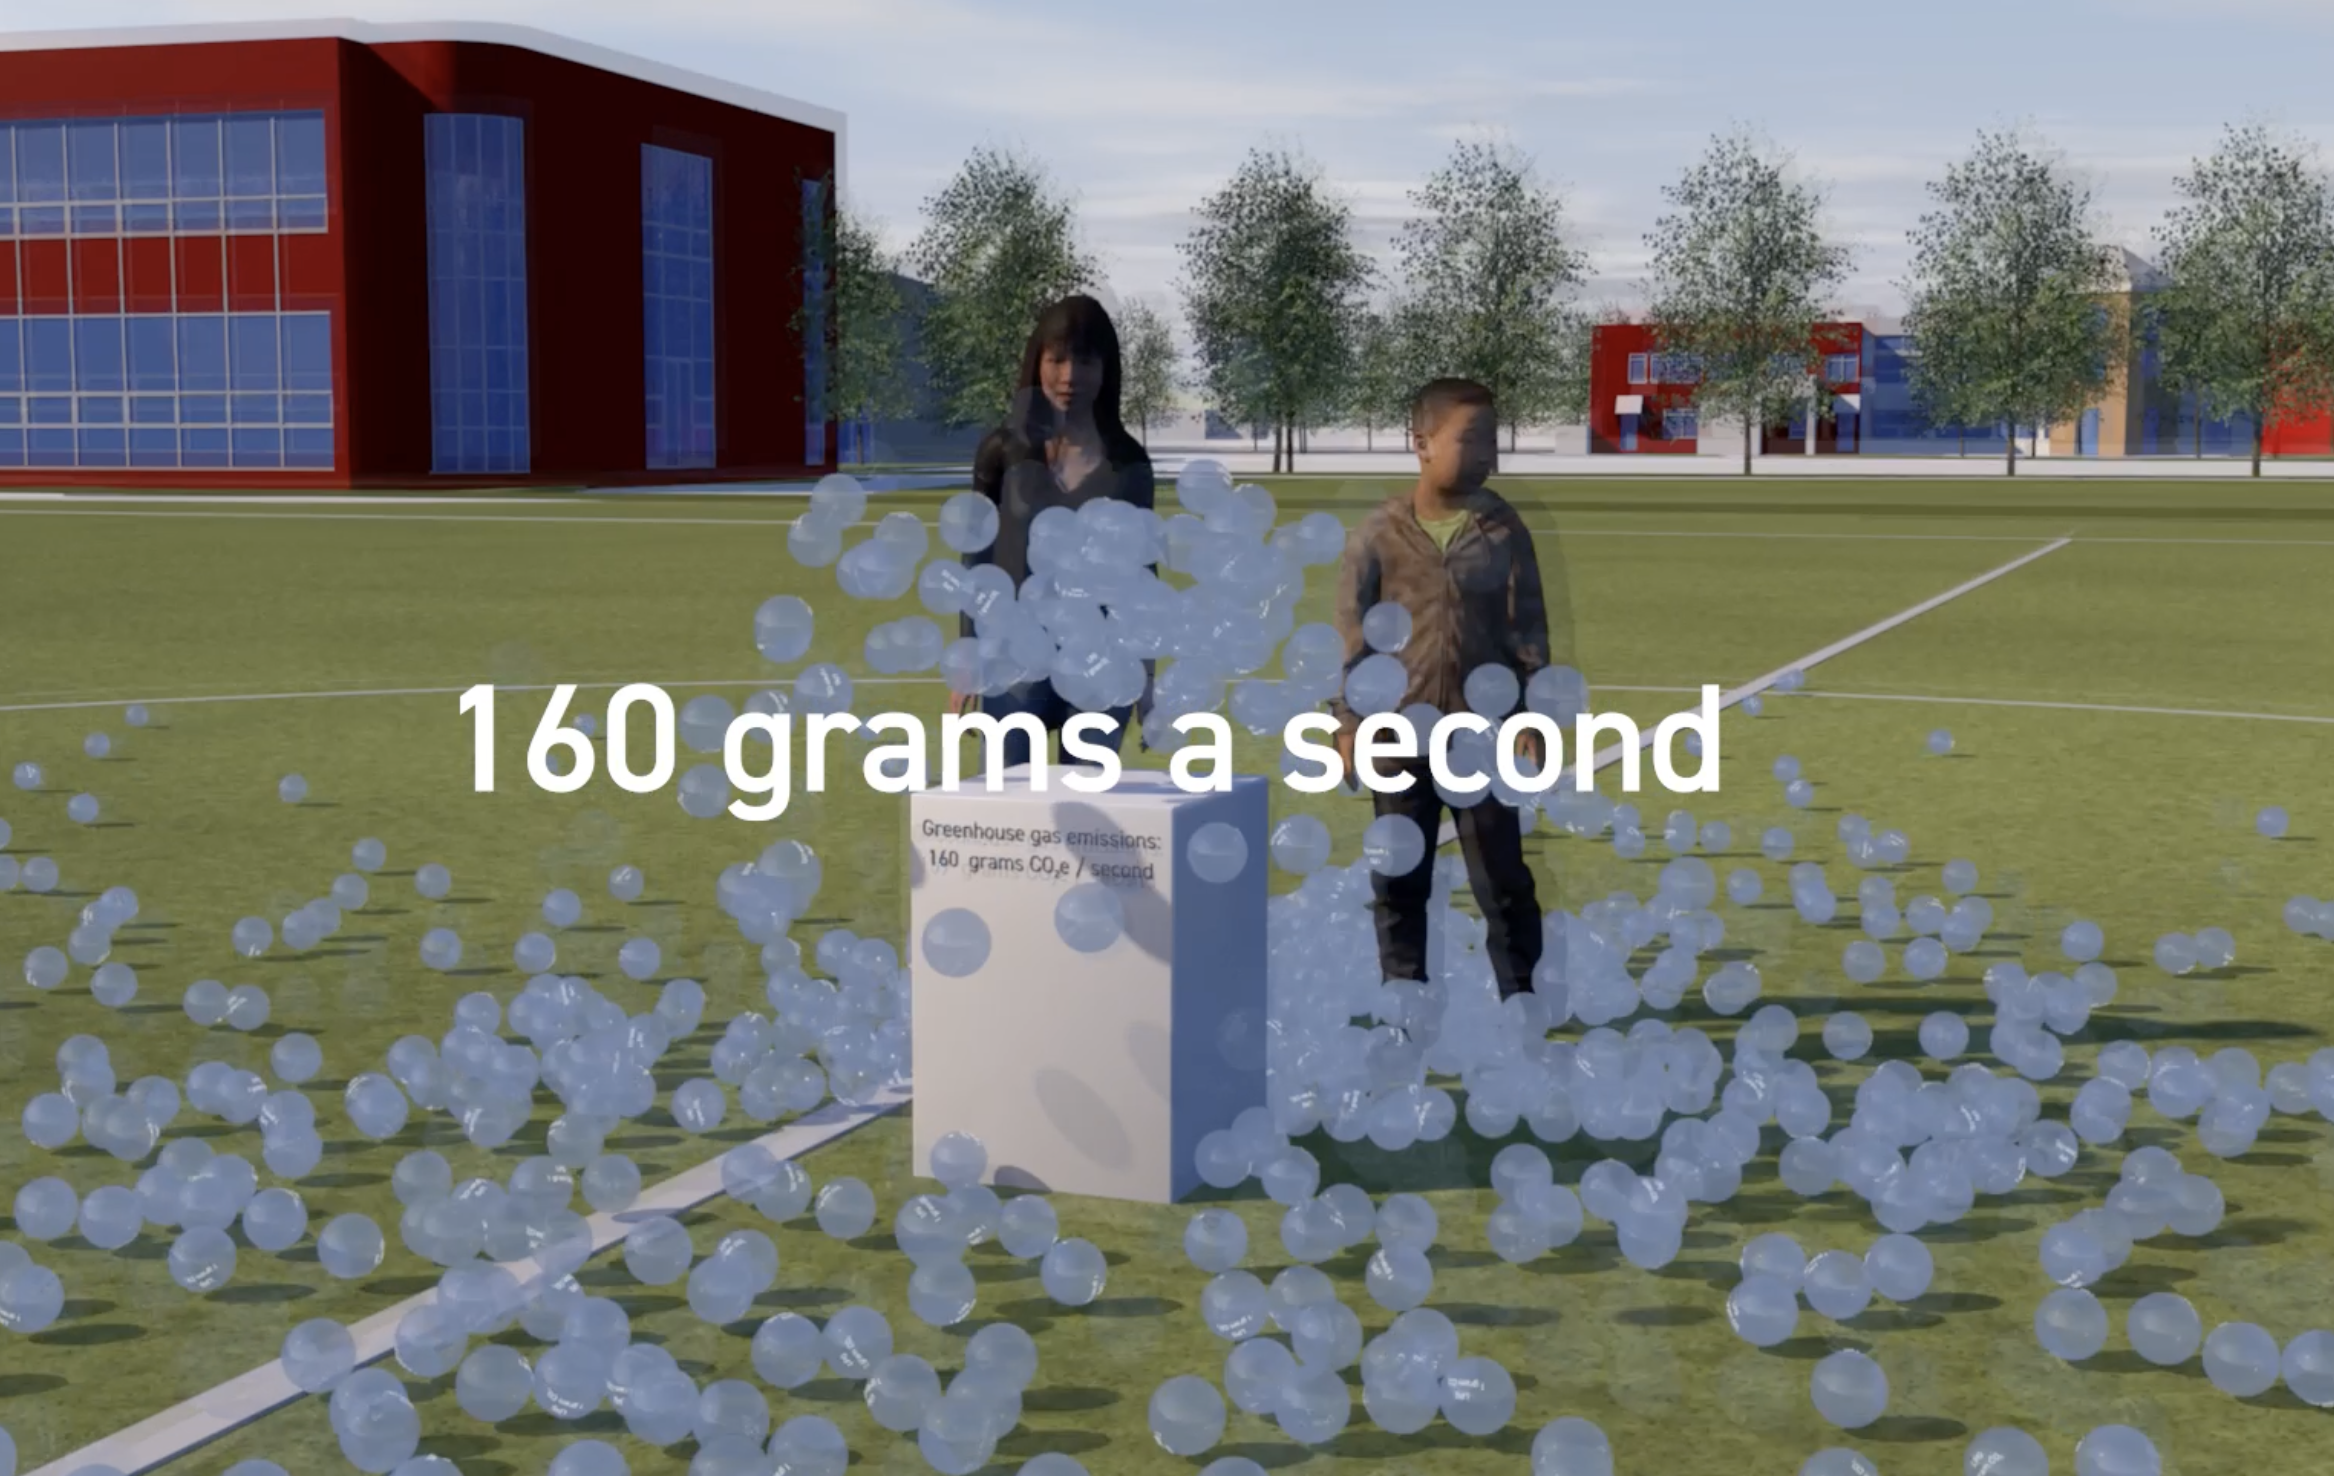
We were fortunate that the school asked their architect to develop a 3D model of its campus. This meant more of our budget could be spent on the animation itself. The animation first shows the ‘footprint’ of the school in real-time as one gram ‘bubbles’ emerging from the ground, then switches to one kilogram (one metre diameter) spheres in the school playing fields representing one day’s emissions. Finally the annual carbon emissions are shown dwarfing the school campus.
If your school, college or university would like to engage staff and students in their ‘carbon story’ the please get in touch. If budget is tight we can create simple images or short animations for social media. A larger budget enables more complex animations that show carbon footprint, savings and targets.
Ocean carbon removal - a climate solution?
The ocean is like a giant sponge, storing sixteen times as much carbon as all the plants on the planet. Technologies are now emerging that use the ocean to actively remove CO2 from the air and help maintain planetary temperature. But how do you communicate the issues, the complex chemistry and scale to people in coastal communities who will be impacted by these technologies?
The ocean is like a giant sponge, storing sixteen times as much carbon as all the plants on the planet. Technologies are now emerging that use the ocean to actively remove CO2 from the air and help maintain planetary temperature. But how do you communicate the issues, the complex chemistry and the scale to people in coastal communities who will be impacted by these technologies?
Video explaining two marine carbon removal (CDR) approaches: ocean alkalinity enhancement (OAE) and direct ocean removal (DOR).
That was the challenge we were set by The Institute for Responsible Carbon Removal and [C]Worthy, a non profit organisation dedicated to accelerating ocean-based climate solutions and their partner the American University's Institute for Responsible Carbon Removal. They wanted our help to communicate ocean-based carbon dioxide removal strategies to engage people at a series of in-person workshops in US and Canadian coastal communities. The intention of the film is to explain the chemistry of ocean carbon removal to facilitate meaningful discussion. But it is not the intention to persuade the audience that ocean carbon removal is a good idea or right for their community.


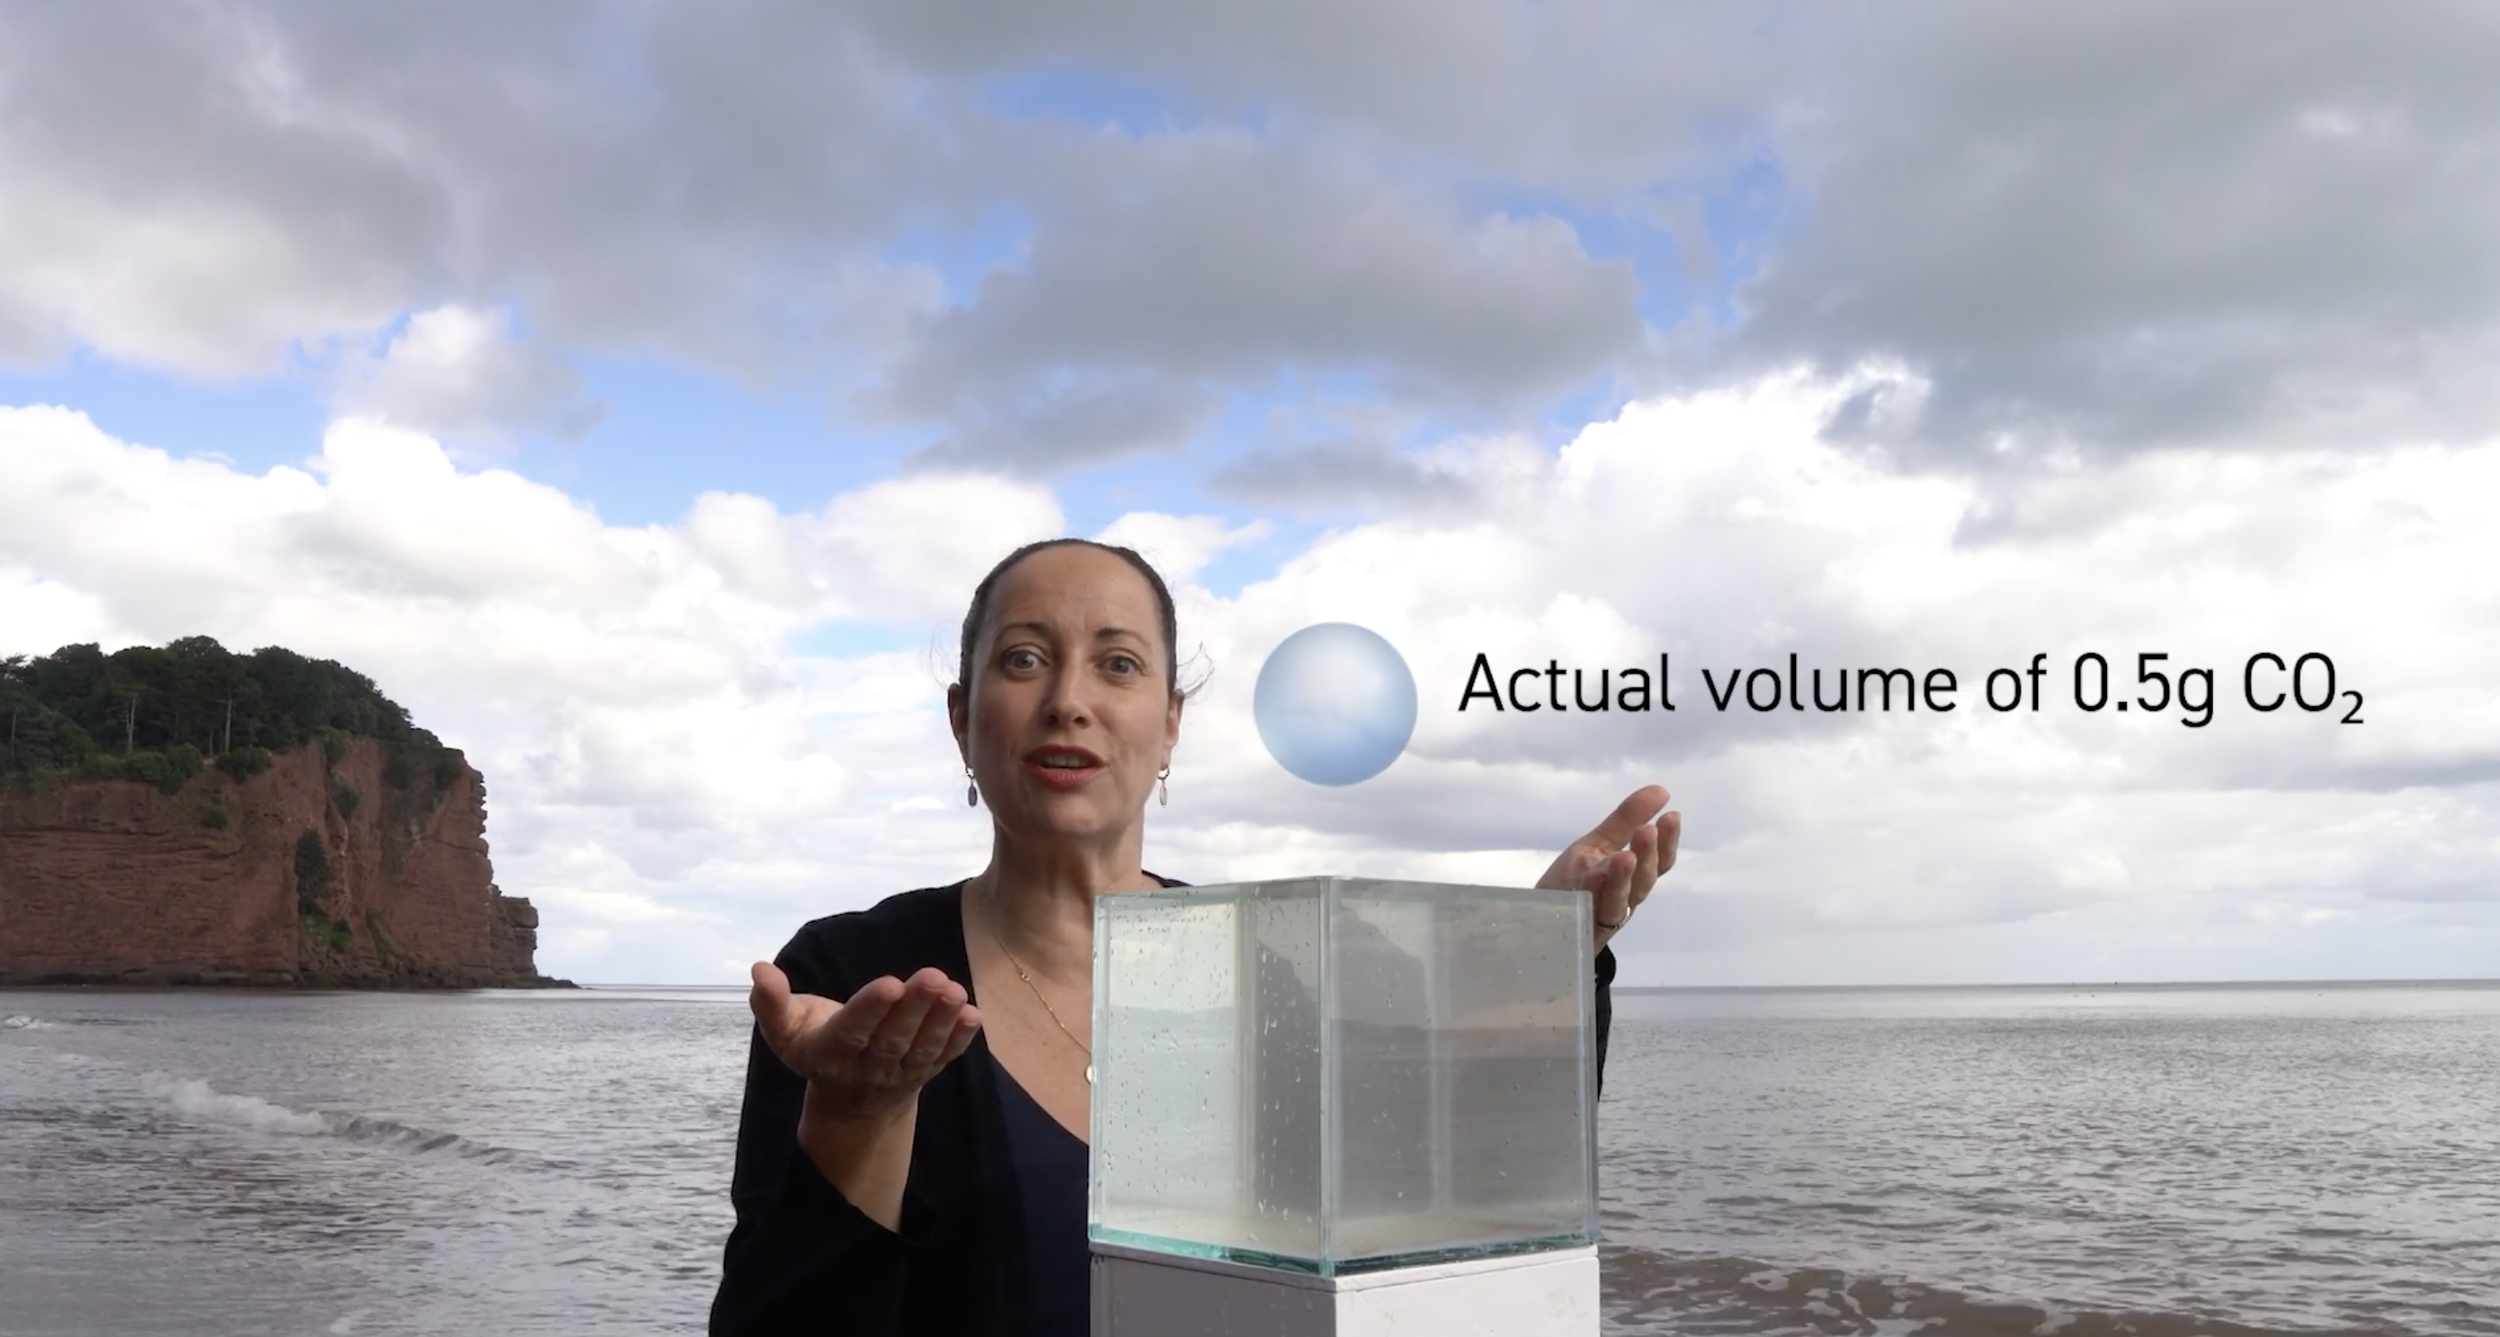
These sketches were created to show volumes of limestone chips and volume of carbon dioxide that could be removed from the atmosphere with successful large-scale ocean alkalinity enhancement.
This film was made over the summer months of 2025 with invaluable CGI assistance from Jon Feuell. The live action scene shot on Holcombe beach, Devon with Director Adam Nieman, actor Rosalind Moreno-Parra, cameraman Will Hodges and general assistant Antony Turner. The plinth and one gallon glass cube were made by Antony Turner and James McHardy.


Further information from [C]Worthy and the Institute for Responsible Carbon Removal.
British Land CO2 Sculpture
Carbon emissions are invisible. So if you’re a major property business how do you communicate your impressive carbon reduction story to staff and customers?
Carbon emissions are invisible. So if you’re a major property business how do you communicate your impressive carbon reduction story to staff and customers?


This was the challenge presented to us by Citypress on behalf of their client British Land. Through a team-driven approach, including a creative workshop, we collectively arrived at the solution - to install an eye catching sculpture together with an accompanying explanatory video. Over summer 2025 the sculpture has toured three British Land campuses—Paddington Central, Broadgate, and Regent’s Place—to share the message with all their office customers. It has been a collaborative effort with the teams at British Land, Citypress, and our suppliers, and we are thrilled with the outcome.
“Sustainability is often abstract, super important, but hard to visualise. Easy to dismiss. But not this time. Our customers asked for help explaining carbon reduction to their teams. So we made it physical. Not a deck. Not a dashboard. Something that cuts through. Because behaviour changes when the data gets real. When you can see it. Stand next to it. Feel the weight of it.
By turning carbon data into something physical and public, this campaign brings to life British Land’s mission to create sustainable, future-ready workspaces across its central London campuses.”
See what British Land’s customers think in this LinkedIn Post
TECHNICAL NOTE
28% of global emissions come from buildings just doing what they do every day - heating, cooling, lighting. That’s the carbon we’re visualising here: the operational side that British Land is actively reducing, one system at a time.
We worked with British Land to translate real emissions data - scopes 1, 2 and 3 expressed in CO₂e - into something people can walk through and experience to help spark conversation.
Each cube in the sculpture is the exact volume of one gram of CO₂* illustrating the average daily operational carbon per square metre of British Land office spaces in:
2019 – baseline year
2025 – a 40% reduction!
2030 – British Land goal: 75% down
A timeline on the floor connects each year with real case studies - like lighting upgrades, heat pumps, and smart building systems.
See more, including explanatory video created by Cosmic Joke:
https://www.britishland.com/news/join-our-journey-creating-sustainable-workspace/
* at sea level pressure 15 degC.

Time is running out
How do you tell the most important ‘story’ in the world? It’s a story that most ordinary citizens don’t want to think about, because it is complex and involves invisible gases. It’s the story of the amount of carbon we can “afford” to put into the atmosphere, taking account of where it might go and what it might do.
How do you tell the most important ‘story’ in the world? It’s a story that most ordinary citizens don’t want to think about, because it is complex and involves invisible gases. It’s the story of the amount of carbon we can ‘afford’ to put into the atmosphere, taking account of where it might go and what it might do. This story is called the carbon budget and it profoundly challenges our assumptions about burning oil and gas to fuel our comfortable lifestyles. And the carbon budget varies depending on the extent to which human society is prepared to take risks on the chance of increased heatwaves, droughts, flooding, sea-level rise and human migration.
This video illustrates the carbon budget available if we want to keep within the 1.5 deg C target of the Paris Agreement.
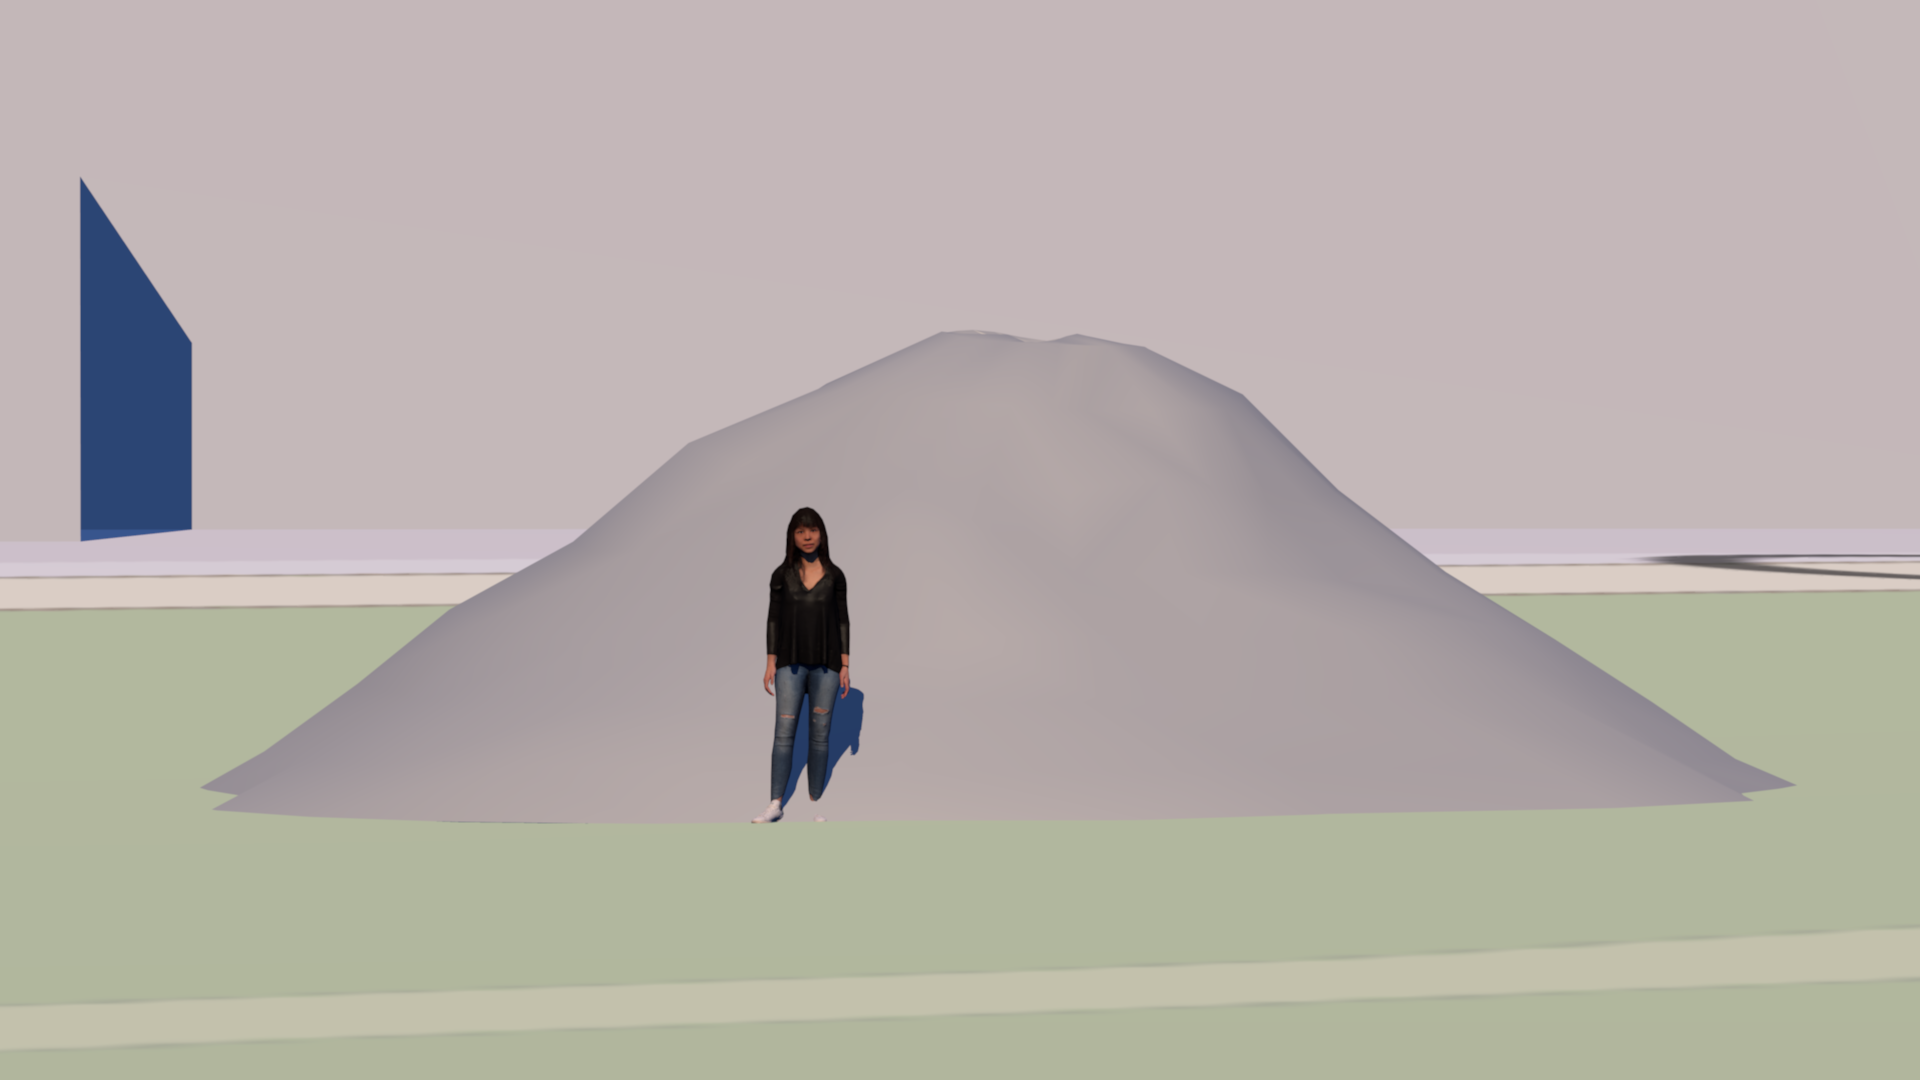
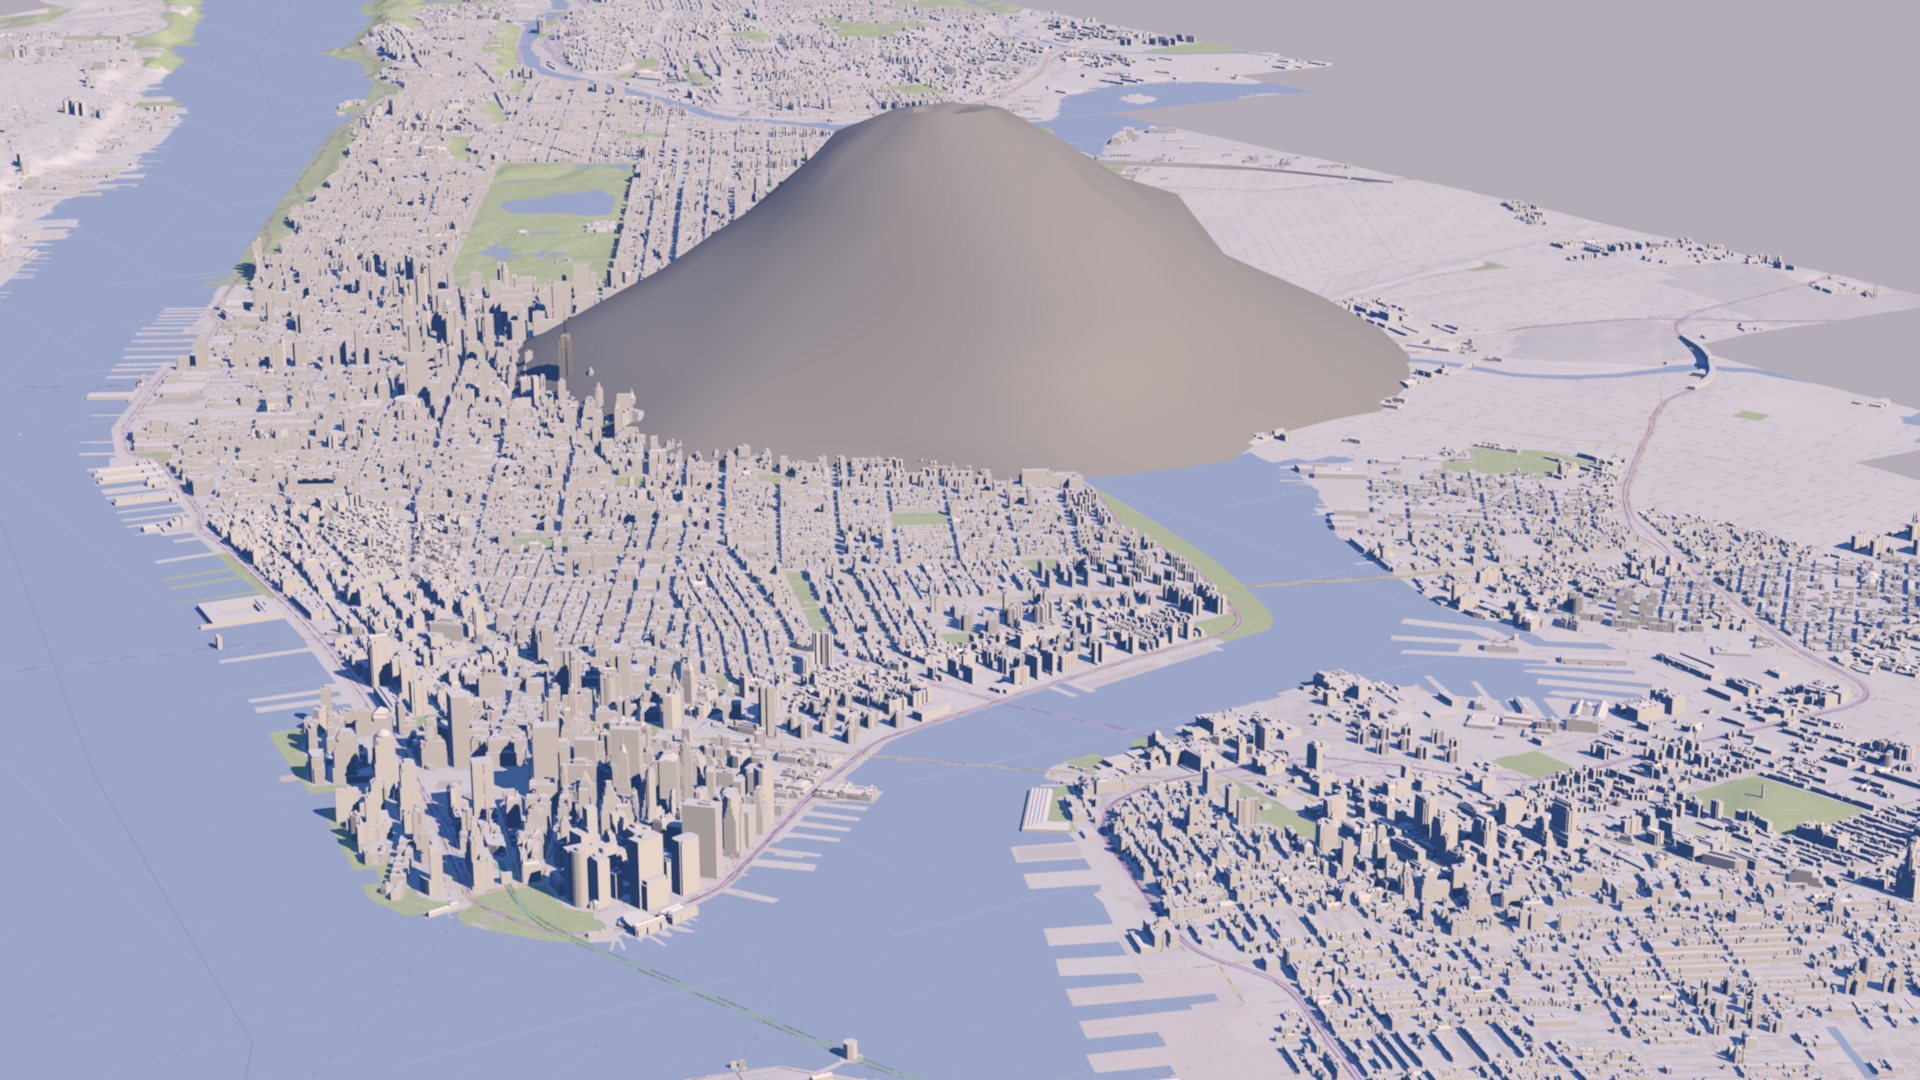
At the current emissions level there is a 50% chance global warming will exceed 1.5 degrees C by 2023. This was the primary message that the Global Carbon Project (GCP), based at Exeter University, wanted to get across not just to policymakers at the Bonn Climate accord in June 2024, but also to the wider public. So they commissioned Real World Visuals to convey the essence of the results after they have done all the laborious measurement, compilation and calculation. And that, as usual, comes down to several short films visualising a volume of carbon dioxide gas.
This video shows the current global emissions of the USA, EU, China and the rest of the world in 1000 metric ton blocks in real-time - 1315 tons per second, 79,000 tons every minute.
Sadly, if delegates at the Bonn meeting had really grasped the essence of the problem, and its urgency, perhaps they would not have settled for such a muddled and unpromising outcome from their various discussions. Politicians need to realise that bold action is now required as this ‘story’ is likely to overshadow everything else in the coming years. And citizens, who will be voting for politicians in the coming months, need to know this too. So please share videos and screen-shots (below) widely!


Notes
A compilation of the two videos together is available here.
The Global Carbon Project (GCP), based at the University of Exeter, was created to bring together a global consortium of scientists to establish a common and mutually agreed understanding of the Earth carbon cycle. Its aim was to use this knowledge to influence policy action to slow down and ultimately stop the increase of greenhouse gases in the atmosphere.

Local solar - the carbon link
Locally owned renewable energy sources can provide multiple benefits. But how do you get local people to invest? A key driver is the net reduction in the local carbon footprint but that involves complex numbers and data. This is where our data visualisation techniques can be useful. Particularly if combined with drone photography.
Locally owned renewable energy sources can provide multiple benefits. But how do you get local people to invest? A key driver is the net reduction in the local carbon footprint but that involves complex numbers and data. This is where our data visualisation techniques can be useful. Particularly if combined with drone photography.
Annual CO2 savings from two solar fairms
Yealm Community Energy is a member-owned society that invests in renewable electricity for the local rural community in the South Hams, Devon, UK. They wanted to launch a community share offer to fund the transfer of three nearby operational solar farms into community ownership. The share offer would enable local people who care about climate change to put their money to work to tackle the issue directly.
So in order to engage the local people we created animations that could grab their attention. Working with local drone photography specialist Ed Smit we combined their drone footage with our CGI effects. By turning the annual carbon data into daily emissions, savings totally and emissions per household, we hoped this would galvanise local people into becoming involved.
Daily CO2 savings from two solar farms
Daily CO₂ emissions from five parishes (1)
Daily CO₂ emissions form five parishes (2)
Happily the long awaited share offer was finally completed on the last day of December 2023. More info on Yealm Community Energy here.

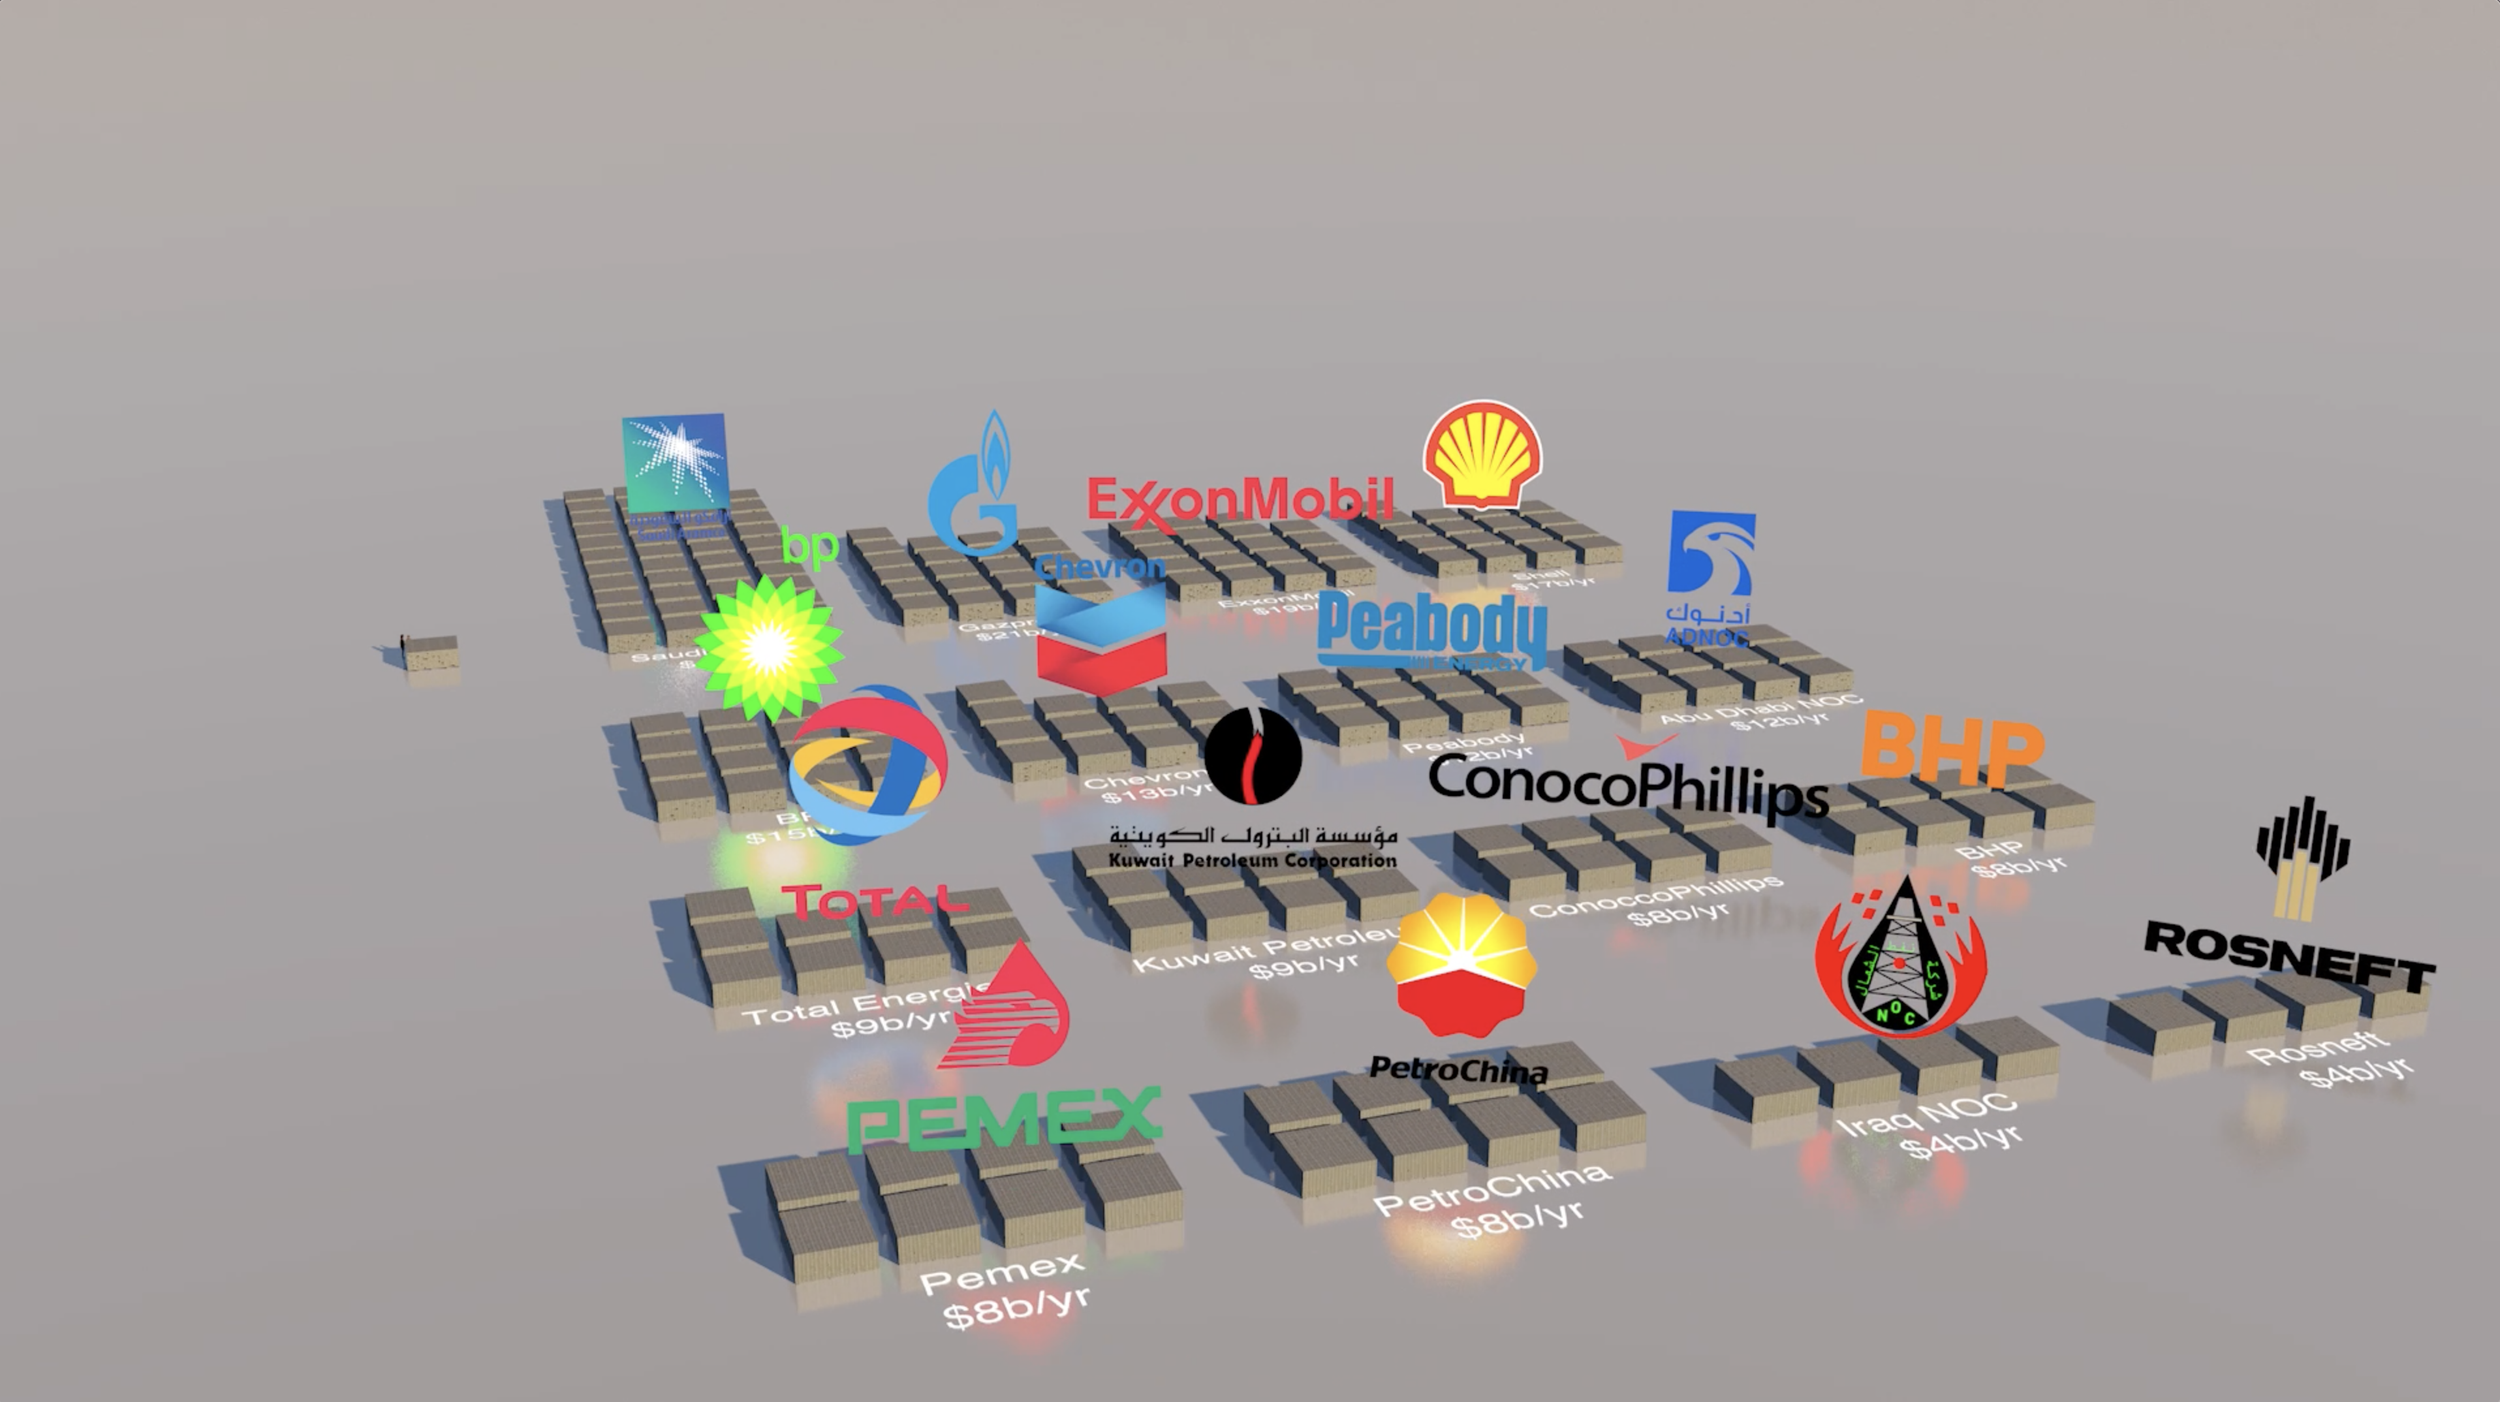
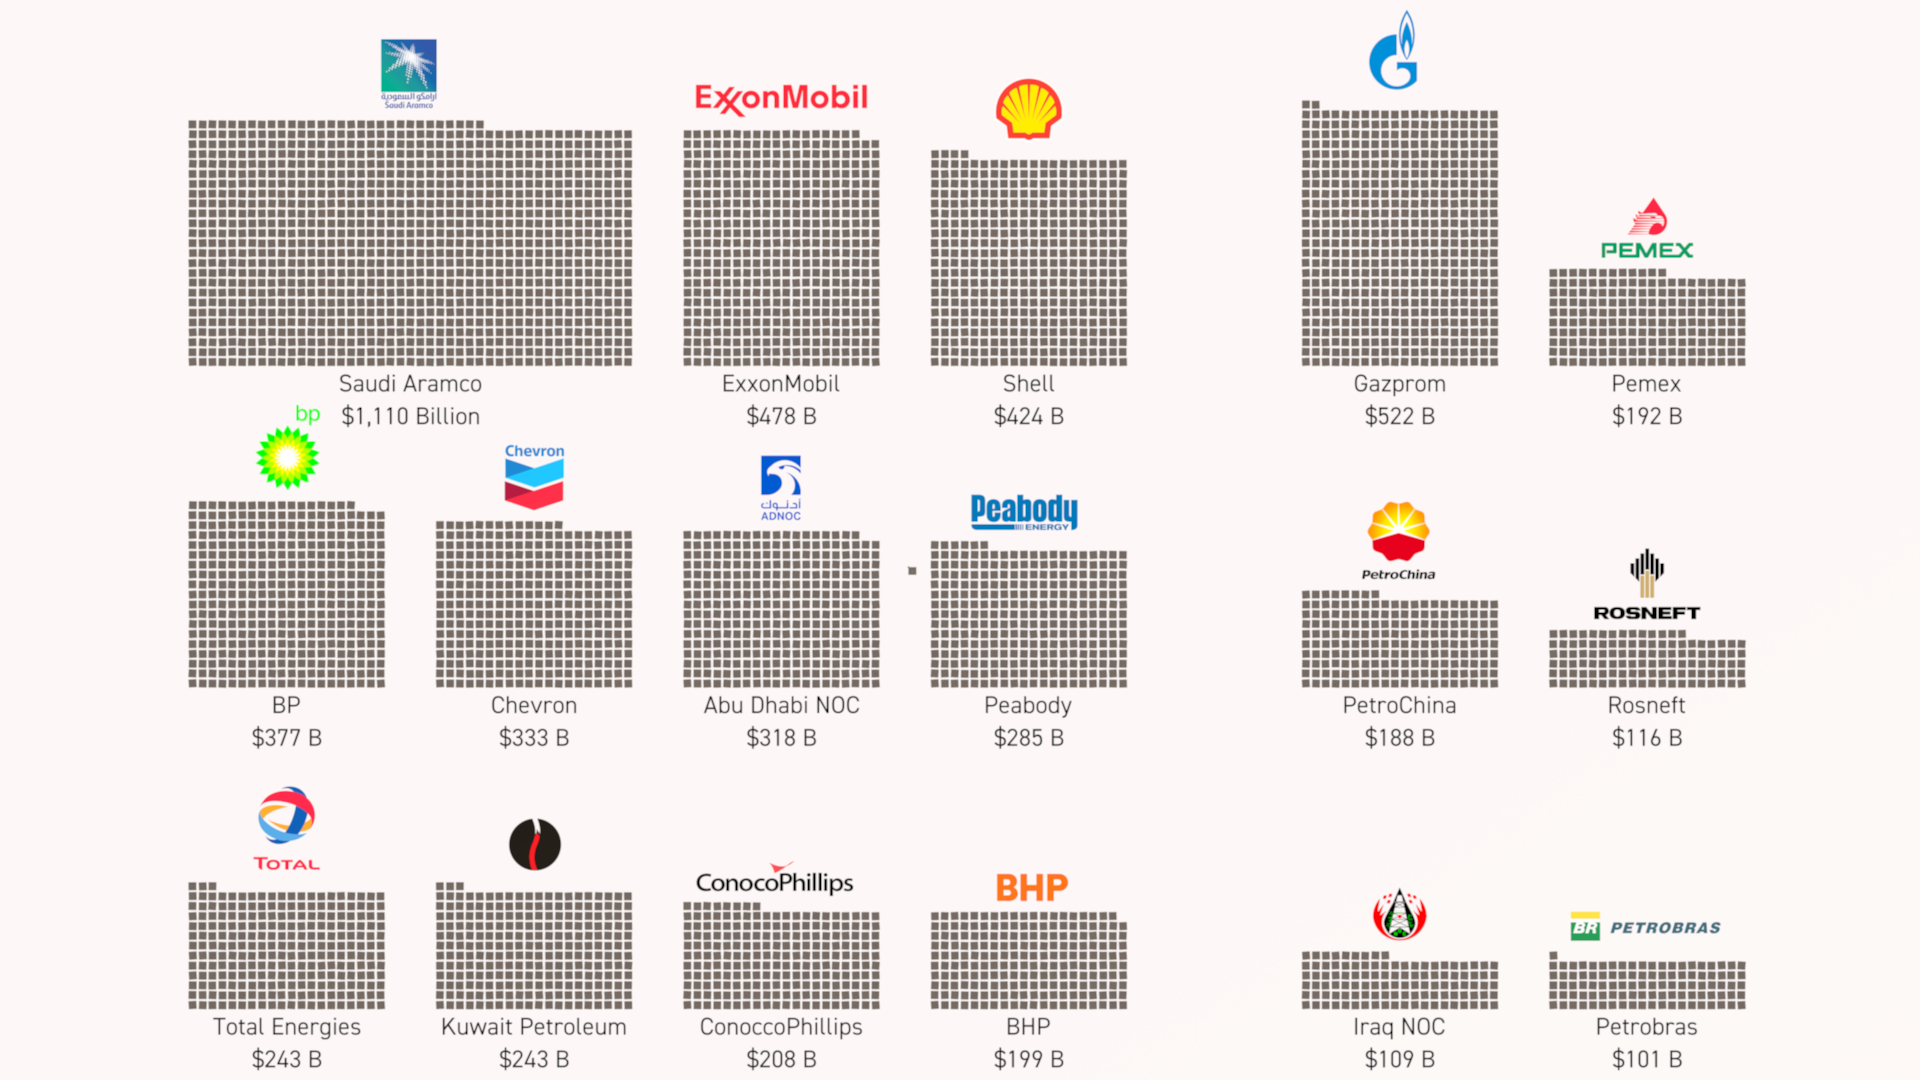
Visualising $209 billion climate reparations
How do you visualise climate reparations? That was the question we were asked last year by researchers investigating potential annual reparations to compensate those communities around the world most damaged by climate change.
How do you visualise climate reparations? That was the question we were asked last year by the Climate Accountability Institute who were investigating potential annual reparations to compensate those communities around the world most damaged by climate change. The calls for climate reparations are rapidly growing in the scientific literature, among climate movements, and in the policy debate. At present the costs of climate change are primarily borne by nation states that compensate their own citizens harmed by climate impacts or covered by insurance companies with regard to people and businesses that they insure. Some countries are also now promising to contribute to the Loss and Damage Fund agreed at COP28 to compensate people in low income countries.
“Time to pay the piper: Fossil fuel companies’ reparations for climate damages” argues that a substantial responsibility for the cost of redressing climate harm lies with the companies that engage in the exploration, production, refining and distribution of oil, gas and coal. The opportunity to help communicate this story was quite a challenge, but we created a simple image based on the data in the Paper. However recently we have been wondering whether the $209 billion dollars attributed to fossil fuel companies could be better illustrated by a CGI animation. This is the result.
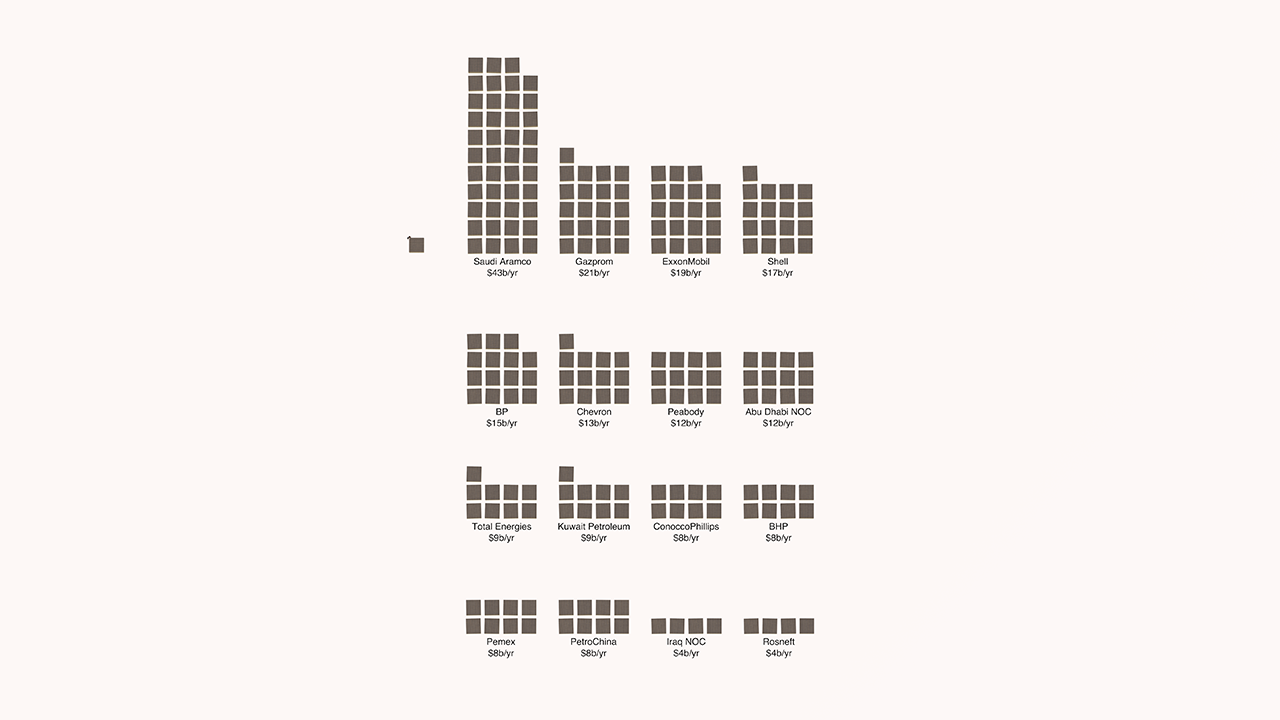
Two perspectives on annual reparations (each block is a $billion)
This is the simple abstract image we created for the Report’s Press Release. Each square represents a billion dollars.
“As increasingly devastating storms, floods and sea level rise bring misery to millions of people every day, questions around reparations have come to the fore.
”
Finally we thought it could be useful to create a simple version just showing what $1 billion looks like (in $100 dollar bills)
Real World Visuals is best known for creating images and animations depicting carbon dioxide emissions, savings and targets. But we have also created visuals to show a variety of ‘invisible’ challenges including air pollution, ozone, water quantities, raw materials and even unwanted Christmas gifts.
Contact us if you have a challenge communicating billions of dollars or billions of tons!

Black cabs go green
It’s time to celebrate when an iconic vehicle like the London black cab goes green. Since its launch in 2018 the TX electric cab has prevented more than 200,000 tonnes of CO2 emissions from entering the earth's atmosphere. So we were happy to make a short film for the London Electric Vehicle Company (LEVC) to get across this good news story.
It’s time to celebrate when an iconic vehicle like the London black cab goes green. Since its launch in 2018 the TX electric cab has prevented more than 200,000 tonnes of CO2 emissions from entering the earth's atmosphere. That’s the equivalent to the emissions of more than 111,000 passenger flights from London to Sydney. It has now overtaken the diesel-powered TX4 as the most common black cab operating in London. So we were happy to make a short film for the London Electric Vehicle Company (LEVC) to get across this good news story.
LEVC manufactures the purpose-built, range-extended electric TX at its state-of-the-art facility in Ansty, Coventry. Featuring flexible space for up to six passengers, the vehicle includes an integrated wheelchair ramp enabling the TX to accommodate a forward-facing wheelchair – the only taxi of its kind to do so. The TX’s eCity technology provides a pure EV range of 78 miles and a total range-extended capacity of 333 miles.
In the last six years, LEVC's TX has travelled more than 650 million miles globally, with the company producing more than 10,000 of its revolutionary electric TX taxis, which have been sold throughout the world. More info here.
“I recently took a ride in an electric TX cab in London and the driver was so enthusiastic. I am delighted that our visual imagery is helping tell this good news story.”
NOTES
The saving attributed to LEVC’s TX is 200 thousand tonnes of CO₂, which would fill 42,749 Olympic sized swimming pools.
A stack of thousand tonne sphere with base 5 x 5 spheres would have eight layers, making its total height of 805.44 metres. The height of the stack is just shorter than the tallest building in the world: the Burj Khalifa, which 829.8 metres. It is the same height as:
8.4 x Big Ben’s (96 metres)
1.8 x Empire State Buildings (443 metres)
4.5 x BT Towers (117 metres)
As one big sphere, 200,000 tonnes of CO₂ would be 588.783 metres
It is equivalent to 16 hours of UK transport emissions
It is equivalent to all emissions from transport in London for 10 days.

Think globally, visualise locally
Dedicated people around the world are addressing local needs related to environmental stewardship and sustainability. But many also want to find a way to educate local leaders not just about the consequences of the climate crisis, but also the need for local climate action. This often means turning local carbon data into stories and imagery that people can relate to…
Dedicated people around the world are addressing local needs related to environmental stewardship and sustainability. But many also want to find a way to educate local leaders and citizens not just about the consequences of the climate crisis, but also the need for local climate action. This often means turning local carbon data into stories and imagery that people can relate to…
This animation was created for Emerald Keepers, a non-profit organisation in the City of Coronado, California who asked us to visualise the carbon footprint of the city. According to the City’s Climate Action Plan, daily life in Coronado and bridge traffic add 4 kg CO₂ to the atmosphere every second. (The figure does not include Navy, School District, nor Port properties.)
Emerald Keepers have over the years done a great job in building community-based programs and educational outreach. These initiatives encourage community involvement while fostering pride in the beaches, bays, and parks of their beautiful city. But they were determined to also influence the City Council to make progress on a climate action plan.
We put extra effort into creating the 3D model of Coronado because we know that boring carbon numbers ‘come alive’ by locating CO₂ ‘bubbles’ in a familiar location.
“WOW! It looks GREAT! Thanks for the extra effort. Tackling the climate crisis is not as easy as one might think but we are making progress and your video has really helped. Now I want to spread it to everyone in our city.”
“It’s been a privilege working with Amy and her team at Emerald Keepers to make this video happen. ”
Vimeo version of video here

We like filling stadiums
Most people who live in or near Los Angeles know the size of the SoFi Stadium. So overfilling the stadium with giant CO2 balls seemed like a good way of helping tell a carbon story for a local freight forwarding company.
Most people who live in or near Los Angeles know the size of the SoFi Stadium. So overfilling the stadium with giant CO2 balls seemed like a good way of helping tell a carbon story for a local freight forwarding company.
Rockit-Global are known for supporting the most legendary acts and emerging artists in their tours across the world. They wanted a short animation and image for their annual ESG Report to illustrate the carbon footprint of their domestic trucking emissions.
If you have a carbon story to tell and want to use one of the world’s iconic stadiums do get in touch.
More information on Rockit-Global’s environmental credentials here.

Iconic buildings help tell carbon stories
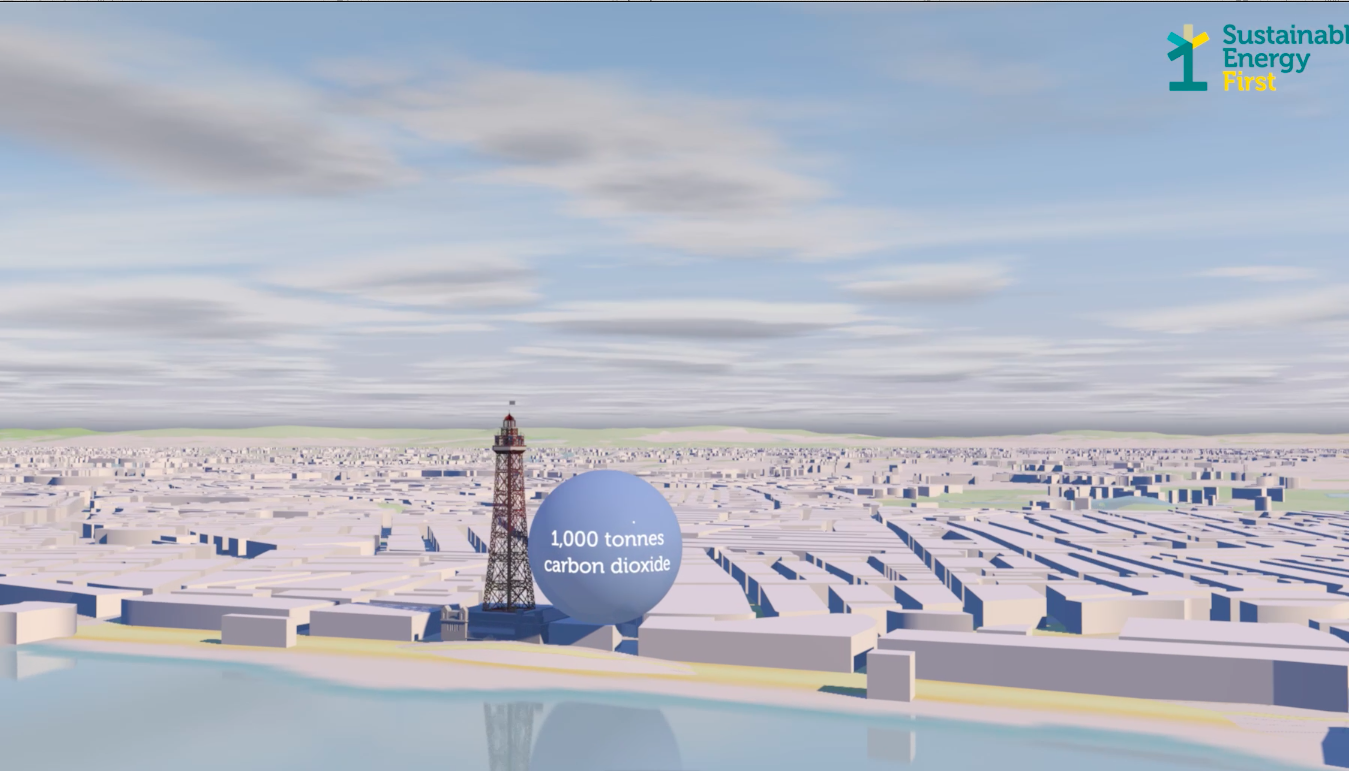
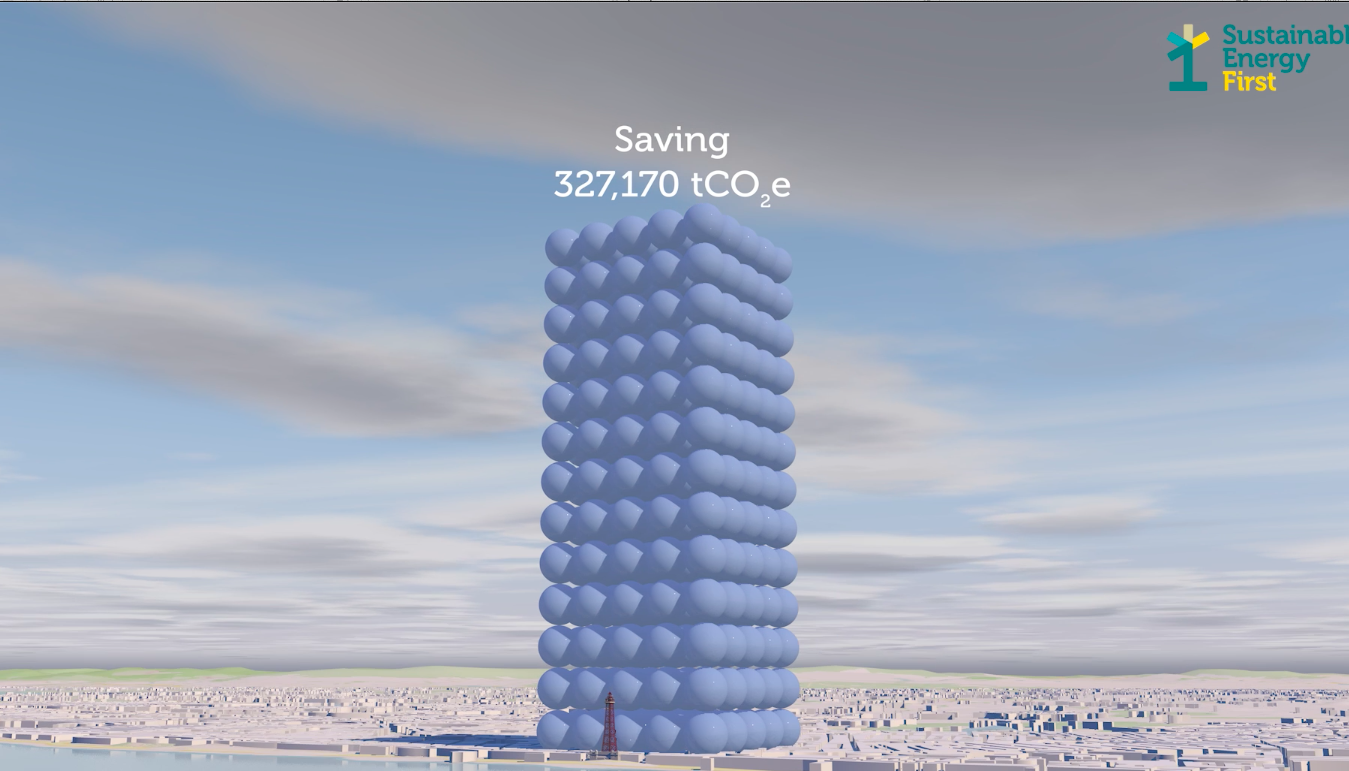
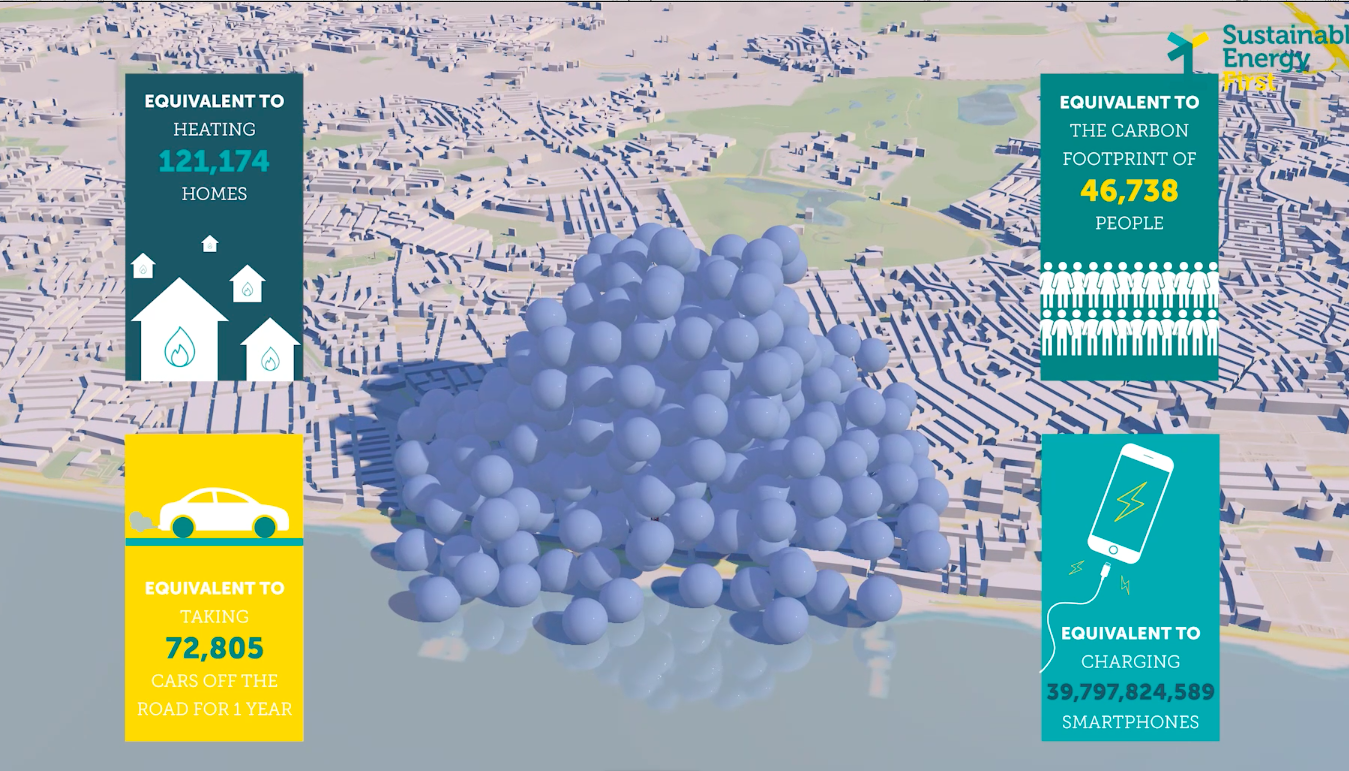
Carbon stories often make more sense if grounded in a particular place and we therefore like using iconic buildings or landmarks to give a sense of scale. So when we were approached by an organisation based in Blackpool we naturally suggested using using the Blackpool Tower.
Carbon stories often make more sense if grounded in a particular place and we therefore like using iconic buildings or landmarks to give a sense of scale. So when we were approached by an organisation based in Blackpool we naturally suggested using using the Blackpool Tower.
Sustainable Energy First (SEF) is an energy and sustainability consultancy, founded to solve energy management problems in very large, complex commercial estates. Their own carbon footprint is relatively small but they identified sustainable energy opportunities for many clients - some of the UK’s most prominent organisations.
They wanted to set a target of reducing emissions for the clients based on the data their analysts identified, extracted and validated. But the challenge was how to present the potential savings - 327,170 tonnes of CO2e by 2028 - to clients in an engaging and effective way. That’s when they approached us - and this animation is the result!
See the SEF Sustainability web page here.
Do get in touch if you feel something similar could help your organisation.

Knowing your place
We often inhabit places without knowing how our activities shape the natural landscape. So map-based stories that visualise what is happening beneath our feet and in the air around us can be helpful. These two videos for Somerset Wildlife Trust are good examples.
We often inhabit places without knowing how our activities shape the natural landscape. So map-based stories that visualise what is happening beneath our feet and in the air around us can be helpful. Somerset Wildlife Trust wanted to show that currently, the way most land is managed in the Somerset Levels and Moors is both contributing to climate change (by releasing greenhouse gases like methane and CO₂) and making us more vulnerable to its impacts, particularly flooding.
“Peat restoration is the quickest way to reduce carbon emissions. And proactive flood management provides multiple benefits to the local community. These great films will be very helpful in getting across our key messages at shows and events. ”
Real World Visuals made two videos to show that by harnessing the power of nature and making a few changes to how people manage land, the Levels and Moors can deliver important solutions that reduce emissions and help people adapt to the changing climate. More information on the Adapting the Levels project here.
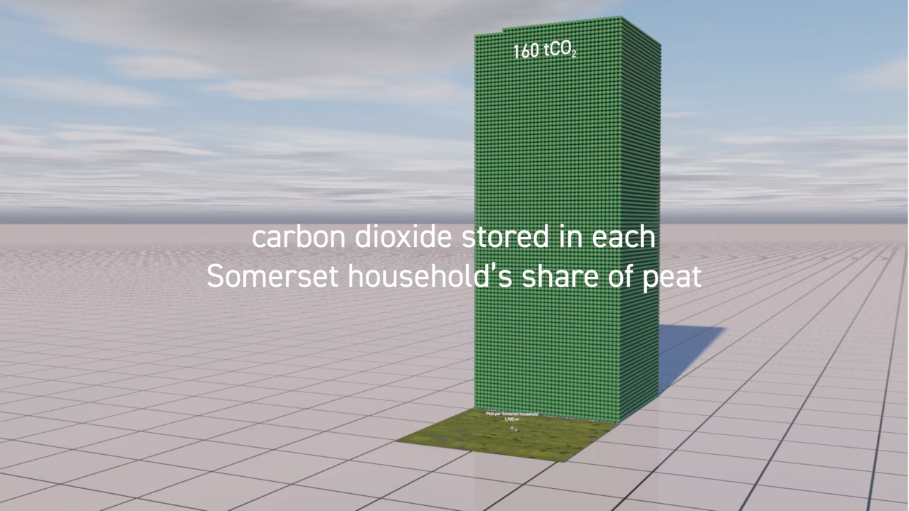
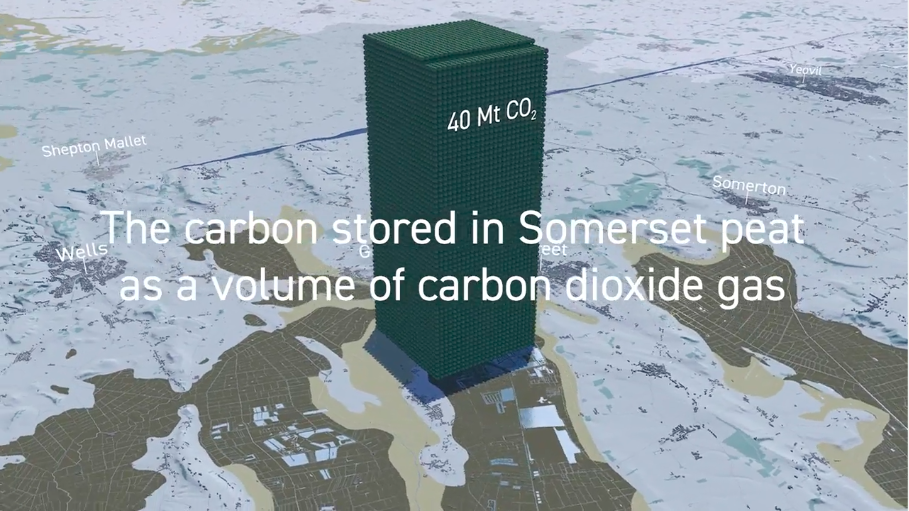
“We are really happy with the end result of both videos. They concisely communicate the issues or peat restoration and river reconnection to a broader audience, and I think the visual elements demonstrating carbon storage and flooding risk are particularly striking, and help bring the story to life”
Do get in touch if you would like an animation to show an important place-based environmental story. info@realworldvisuals.com

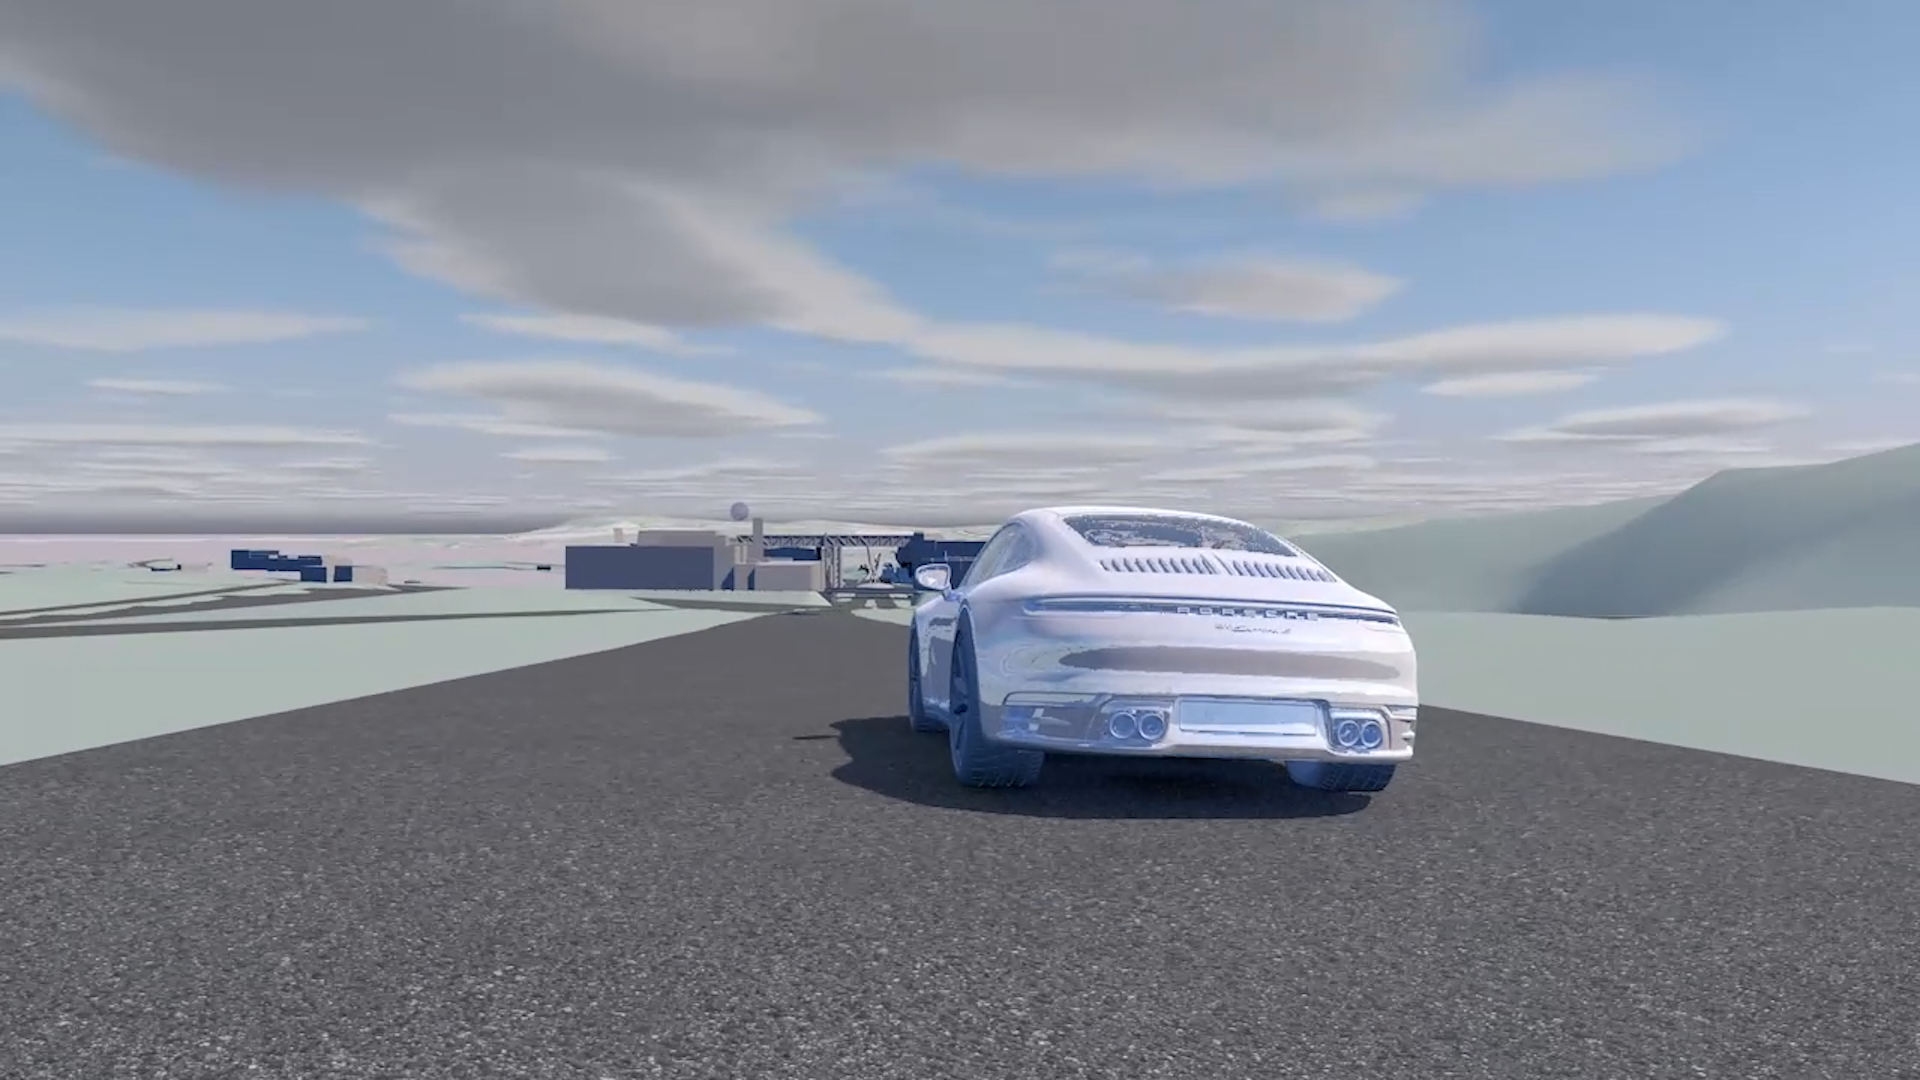
Helping tell Porsche’s carbon story
How can global car manufacturers show climate change leadership? Phasing out petrol and diesel vehicles alone is not enough as making electric cars uses a lot of energy, particularly in the manufacture of the batteries. So the challenge is to engage with the supply chain and get them also to reduce emissions - primarily by only using renewable electricity.
How can global car manufacturers show climate change leadership? Phasing out petrol and diesel vehicles alone is not enough as making electric cars uses a lot of energy, particularly in the manufacture of the batteries. So the challenge is to engage with the supply chain and get them also to reduce emissions - primarily by only using renewable electricity.
Porsche is now doing this by calling on its approximately 1,300 direct series suppliers to use only renewable energy in new projects for the manufacture of Porsche components. It’s a big ask and requires a huge engagement programme with staff and suppliers.
That is why in 2021 Real World Visuals were approached to make an animation to explain the carbon reduction strategy to employees and selected suppliers, backed up by detailed data. The full video is naturally confidential, but the above is an extract to give a flavour of what can be done to get across the message.
“We did fully utilize the video during our face to face training programs and I feel it added value for our participants.”


Trees store carbon
In 2014 we made a video set for Wood for Good, the UK timber industry’s promotional campaign, showing the carbon benefits of using wood and timber in the UK construction sector. The brief, eight years later, was to make shorter versions of the films suitable for educational use and social media sharing
We made a video set in 2004 for Wood for Good, the UK timber industry’s promotional campaign, showing the carbon benefits of using wood and timber in the UK construction sector. The brief, eight years later, was to make shorter versions of the films suitable for educational use and social media sharing.
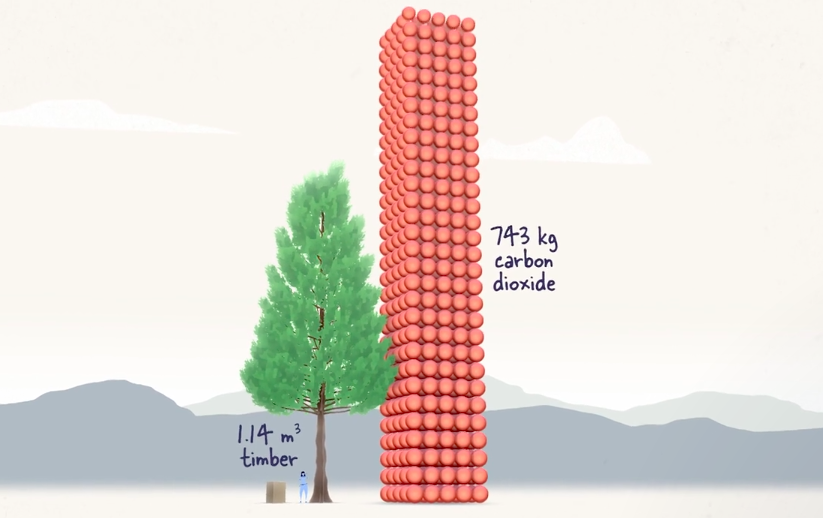
The idea was to inform the audience about storage of carbon, replanting of trees, substitution of wood materials for more CO2-intensive building materials.
The target audience was UK Builders, architects, planners, engineers, specifiers, contractors, surveyors; UK Policy makers/local authorities and those who may have no / little prior knowledge of the technical/scientific processes behind carbon sequestration
Wood for Good wanted to show students at university/school level and educate them on the benefits of timber as a building material or to illustrate carbon sequestration. They also wanted to help timber industry to market timber’s environmental benefits and help them to reach their own sales/business goals.
All four videos as one are here.

Transport emissions come to life
How do you highlight the climate benefits of using electric bikes and e-scooters in cities? This was the challenge set by Beam Mobility, the largest micro-mobility operator in the Asia Pacific region.
How do you highlight the climate benefits of using electric bikes and e-scooters in cities?
This was the challenge set by Beam Mobility, the largest micro-mobility operator in the Asia Pacific region. Public transportation conveniently takes people to and from the general area of their destination. However, there is an issue with completing the first and final parts of their journey and this is where Beam’s electric micro-mobility vehicles come in. Beam’s mission is simple – to turn little drives into better rides and make cities flow better for everyone.
Beam wanted to create eye-catching visuals to dramatise the emissions problems they are trying to solve in major cities in the Asia Pacific Region. So we created a set of short videos and accompanying images showing the transport-related carbon emissions in ten cities.
“The videos starkly illustrate the need to reduce the number of private vehicles on the road and use alternatives with emission-free public transport infrastructure.”
The imagery has been used widely by the company in newsletters and on social media - see here how Beam have used these visuals in their PR campaign, here an example of a Malaysian ‘citizen’s journal’ and below - an example of visual use in a Beam newsletter. https://www.ridebeam.com


UK Household emissions
A set of simple images showing the carbon emissions associated with an average UK home.
How would it feel if we could see the invisible carbon emissions associated with our daily lives?


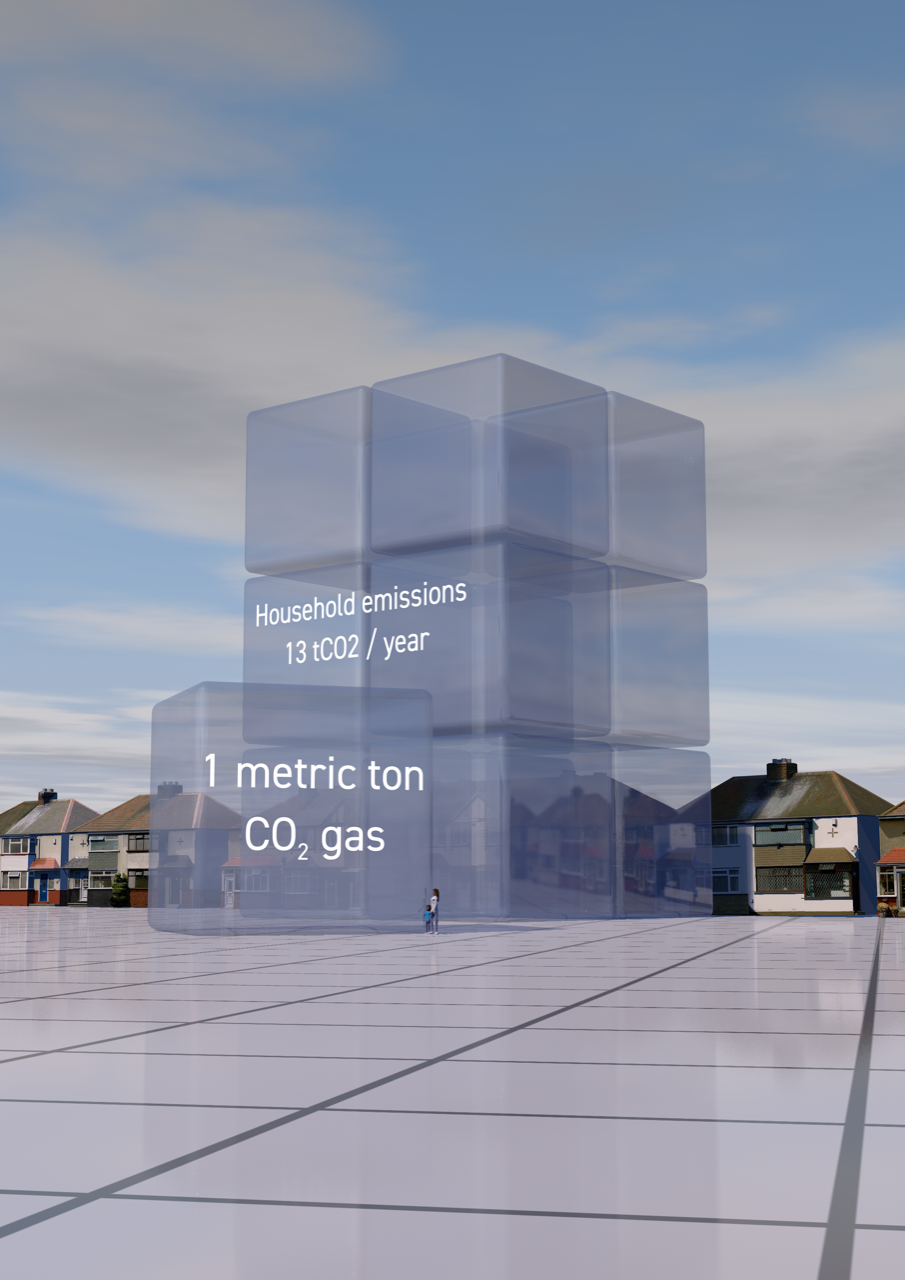

We created a set of simple images showing the carbon emissions associated with an average UK home. These were designed for A3 Posters for an exhibition organised by Teignbridge Action on Climate (ACT). They show the carbon emissions associated with energy, transport e.g. car use, food, goods and services. Data has come from here: Impact Tool
Feel free to download and use for education or training. Images are licensed for use under Creative Commons.

Electric vehicles - the raw materials
Electric vehicles are at the heart of the clean energy transition. But as prices reduce and manufacturers increase their model line ups where are the raw materials needed to produce rapidly increasing volumes of EVs going to come from?
Electric vehicles are at the heart of the clean energy transition. But as prices reduce and manufacturers increase their model line ups where are the raw materials needed to produce rapidly increasing volumes of EVs going to come from?
This is the key question that this film, presented by Professor Iain Stewart, and commissioned by SRK Consulting seeks to address.
The film aims to raise public awareness of the positive role geologists, geoscience, and in particular, mining of metals and other raw materials, will play in the transition from fossil fuel to electric vehicles.
“We love the video. The (patient) RWV team gave artistic direction and relevance to our ideas and really brought them to life in a way we didn’t expect.”
Client: SRK Consulting https://www.srk.com
Thanks for contribution to the film:
Professor Iain Stewart https://www.plymouth.ac.uk/staff/iain-stewart
Epiroc https://www.epiroc.com/en-uk
Extract GIF from the film showing the global volume of materials needed for the world’s electric vehicles.

What’s the carbon footprint of cement?
The global cement / concrete supply chain currently produces a disproportionate amount of greenhouse gas emissions. Innovative solutions that make cement and concrete production and usage sustainable are urgently needed. But how do you bring together different technology, finance and academic stakeholders to rapidly reduce those emissions?
The global cement / concrete supply chain currently produces a disproportionate amount of greenhouse gas emissions. Innovative solutions that make cement and concrete production and usage sustainable are urgently needed. But how do you bring together different different academic, financial, and industrial stakeholders to rapidly reduce those emissions?
Real World Visuals were contacted by Pure Green Cement, a membership organisation that provides a platform to accelerate connections between stakeholders with a vested interest in climate change mitigation in the cement / concrete industry. They wanted to bring innovative ideas out of papers and labs and into real world solutions by accelerating connections between academia, industry, and the financial sector. They firmly believe that innovations needed in this industry reside in the minds of academics, and by bridging academia with necessary funding and resources, they aim to build the foundation for a greener cement industry.
We created a simple animation designed to catch the attention of academics / researchers working on carbon abatement research as well as members of the financial community looking to fund projects that mitigate climate change. The film not only shows the carbon footprint of global cement production, but it makes it ‘real’ by also showing the volumes of cement. A good example of our ‘concrete visualisation’.
“As a disproportionate CO2 emitter, the cement industry needs innovations that will reduce its carbon footprint. However, it is hard to grasp just how much cement is produced worldwide and the associated CO2 emissions by looking at numbers on paper. PGC wanted to give our audience a way to visualize these stark figures in order to demonstrate the need for emissions reductions in this vital industry, and RWV’s video has helped us achieve this.”
Data and assumptions behind this video can be found here: Data and Assumptions
Client: https://puregreencement.com

Commuting to work - what is the carbon footprint?
The Western Australia Water Corporation wanted to help employees understand the carbon footprint associated with their commuting to work.

Should commuting to work be counted as part of an organisation’s carbon footprint? Technically employee commuting is classified as indirect (Scope 3) emissions. But responsible organisations can help employees engage with the climate challenge by helping them understand their commuting carbon footprint.
The Western Australia Water Corporation did just that. They hoped to encourage employees to change commuter behaviour or offset their commuting carbon emissions. But to do that they wanted to make their emissions ‘real’, and so came to us for help.
We created a set of still images together with two short animations showing the commuting carbon emissions set next to the Water Corporation headquarters in downtown Perth. This is a good example of a simple and fast project using the in-house enhanced capabilities we have developed over last two years.
“Thank you very much for your help and great work. The story published in our intranet and internal news has had an immediate strong response. Very impactful.”

Client: www.watercorporation.com.au

All forests are not the same
Primary ‘old growth’ forests are unique and irreplaceable. But how do you get that message across to governments, policymakers and corporations? And the message that not all forests are the same?
Primary ‘old growth’ forests are unique and irreplaceable. As well as sustaining local communities, they protect over two thirds of the planet’s land and freshwater species, including countless endangered species. They are natural quarantine areas, preventing the spread of zoonotic diseases like COVID19. And they store vast amounts of carbon from the atmosphere, half of which is locked up in the massive old trees which tower over the forest canopy. But how do you get that message across to governments, policymakers and corporations? And the message that not all forests are the same?
We were asked by two campaigning NGOs IntAct and Wild Heritage, to create videos that get across these important messages. Firstly how much forest remains - we are currently losing a hectare of these forests every two seconds - and how much has been lost to degraded, regrowth and plantation forest.
Secondly, the destructiveness of the practice of ‘sustainable forestry’ in old growth forests, particularly in the tropics. This popular way of ‘preserving’ these forests is to only take out the big old trees as these are the most valuable. But this practice can only work when a few trees are removed and replacements are given at least 100 years to regrow, something that rarely happens in practice.
So please watch the videos, pass the links to friends, family and colleagues. You might like to think about a more sustainable alternative when you are next looking to replace your kitchen worktop with a hardwood like Iroko.

Can humour help the climate crisis?
The world is waking up to the climate crisis. Children are protesting and Extinction Rebellion has gone global. But many people are still unaware of the carbon emissions associated with everyday activities. That’s why we have teamed up with innovative multi-media theatre company Forkbeard Fantasy to see if humour could help.
The world is waking up to the climate crisis. Children are protesting and Extinction Rebellion has gone global. But many people are still unaware of the carbon emissions associated with everyday activities. That’s why we have teamed up with innovative multi-media theatre company Forkbeard Fantasy to see if humour could help.
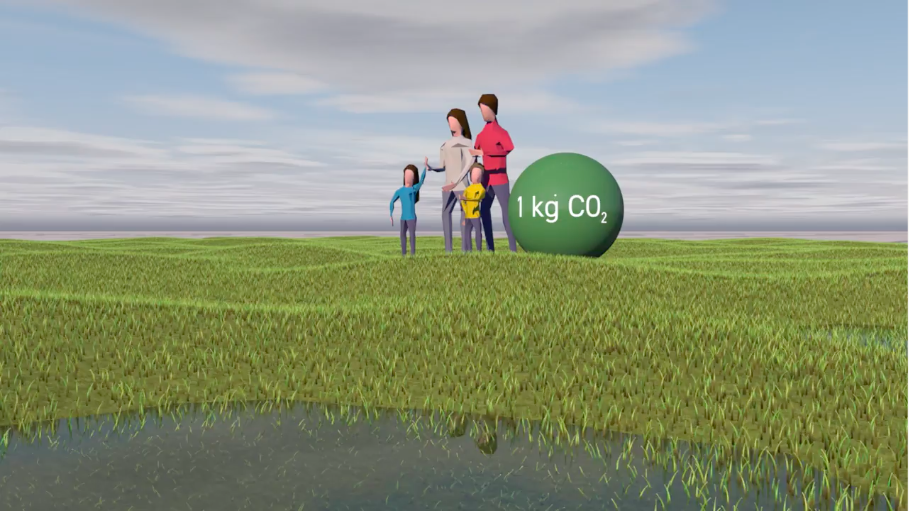
Each one of us is responsible for about 15kg of CO2 per Weevil per day. Placed in a sphere its volume would translate as this
The Carbon Weevils are a strange species obsessed with digging up and burning fossil fuels. They were originally created in 2007 by innovative multi-media theatre company Forkbeard Fantasy for a theatre production about climate change.
We have now decided to collaborate with Forkbeard to see if comedy could help people better understand the climate crisis. By combining the comic element of the Carbon Weevils with scientifically accurate data visualisation we hope to motivate responsible actions.


See more at www.carbonweevils.org