
Here are some of the climate related resources that governments, organisations and companies have commissioned from us.
LATEST
Our latest climate-change related projects…
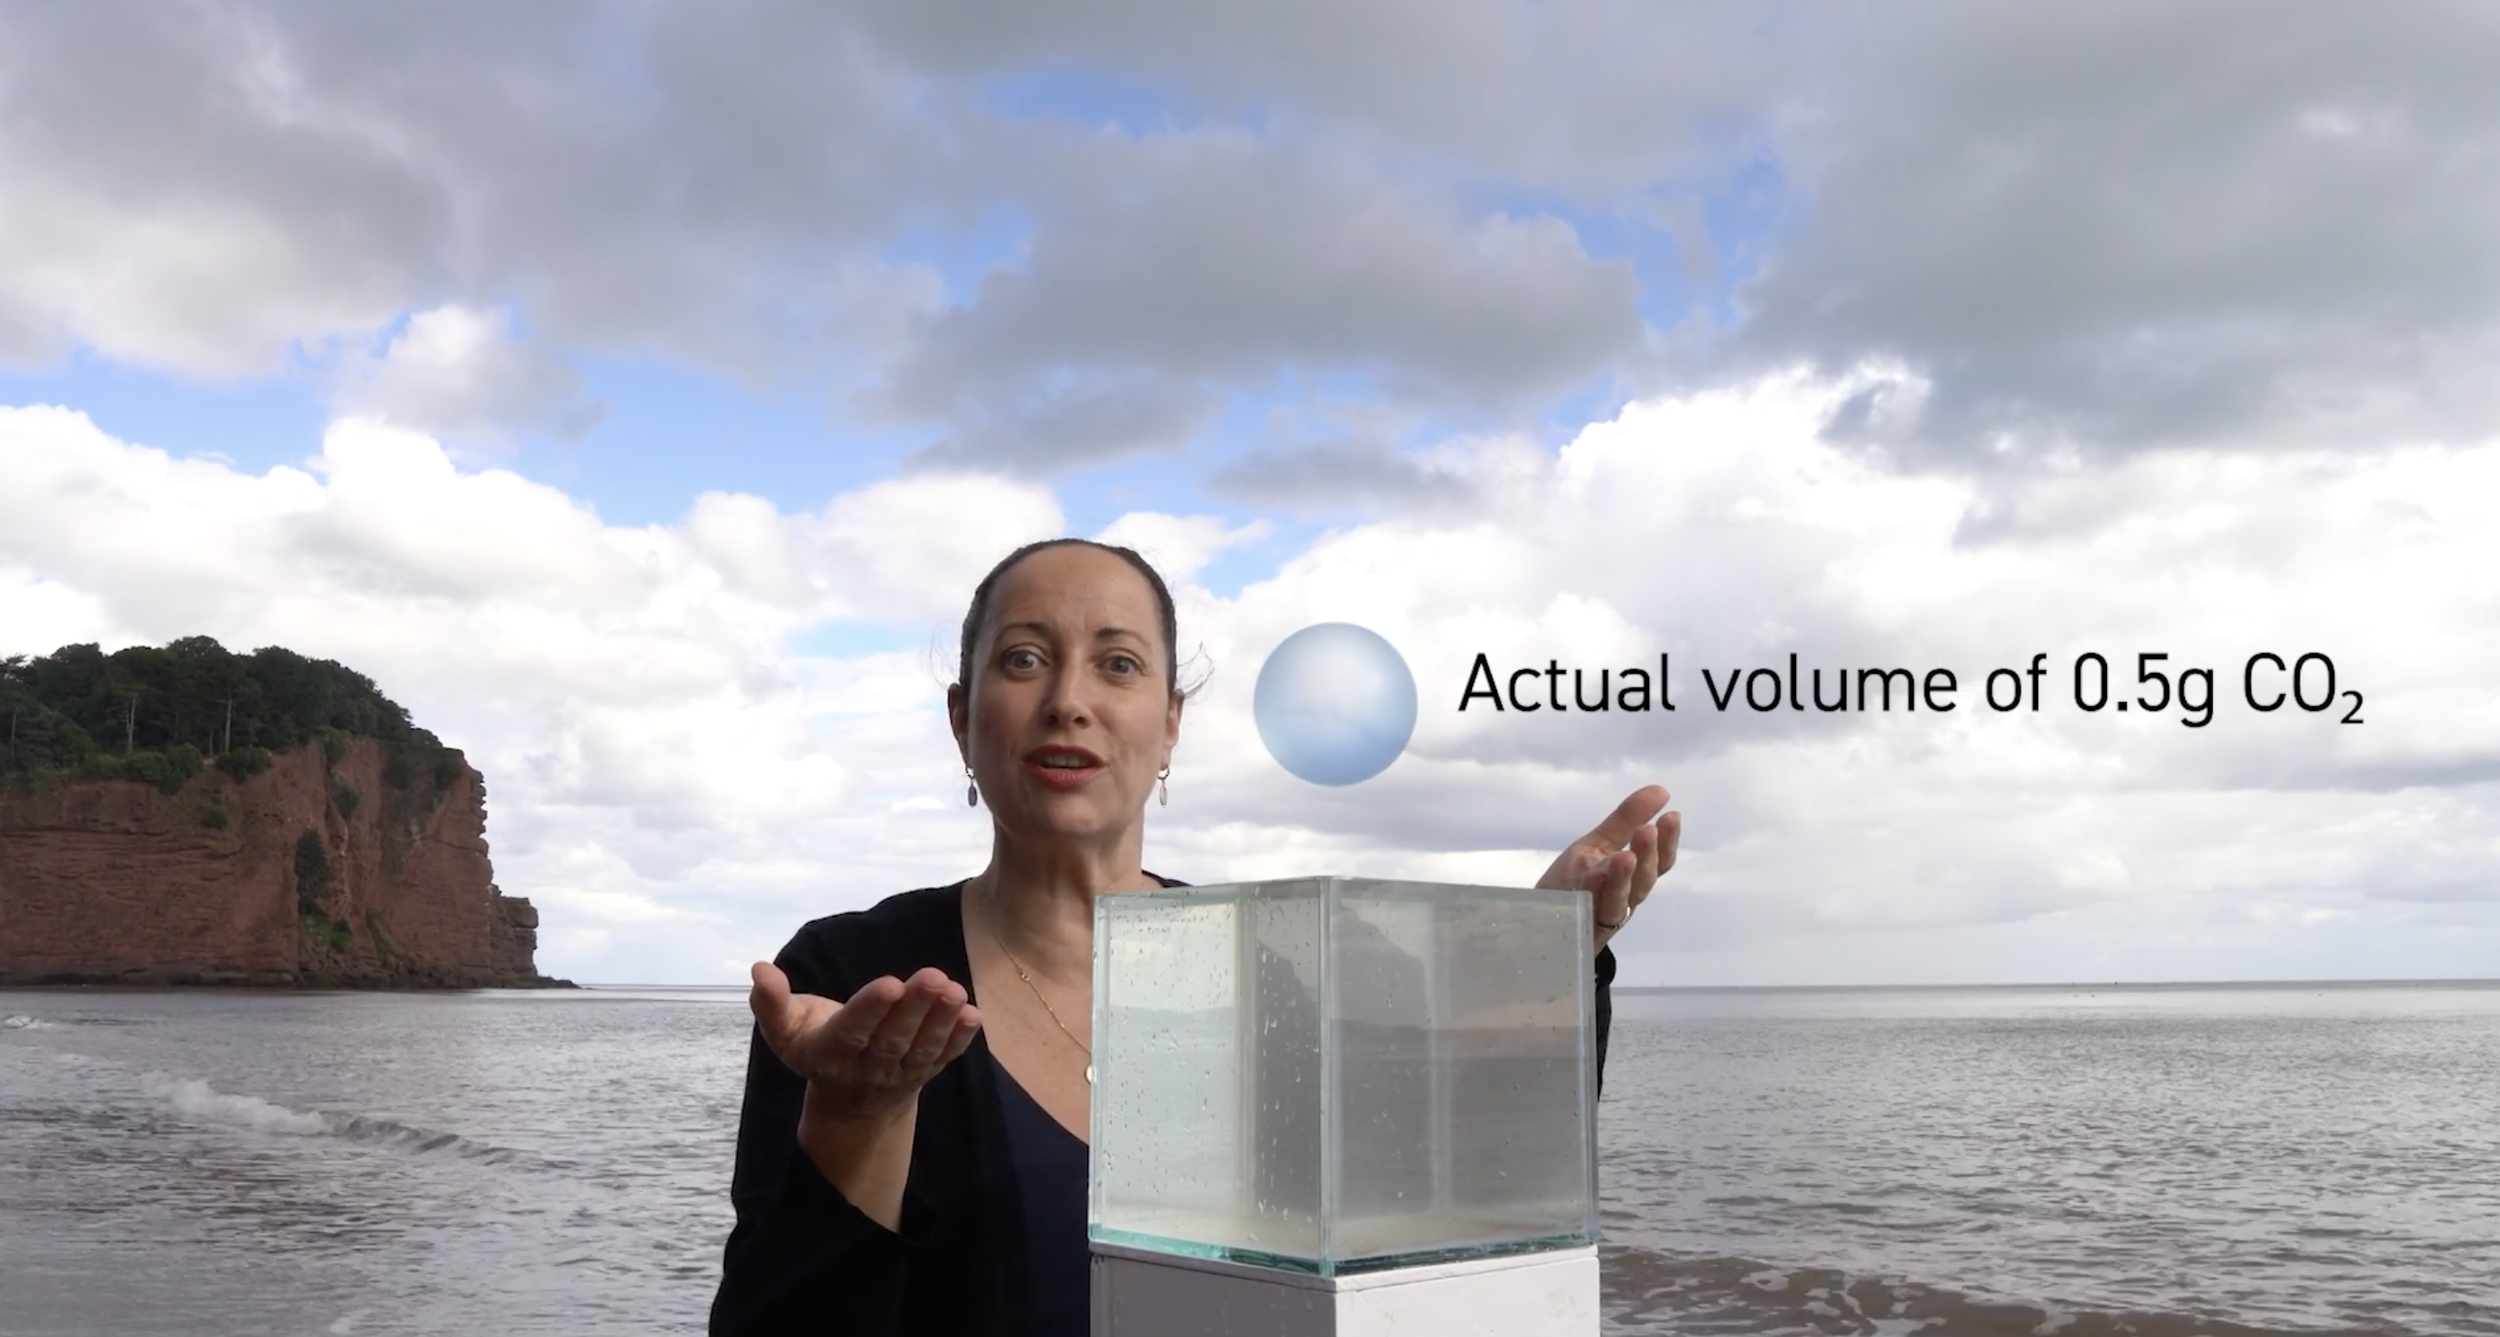
The ocean is like a giant sponge, storing sixteen times as much carbon as all the plants on the planet. Technologies are now emerging that use the ocean to actively remove CO2 from the air and help maintain planetary temperature. But how do you communicate the issues, the complex chemistry and scale to people in coastal communities who will be impacted by these technologies?

Carbon emissions are invisible. So if you’re a major property business how do you communicate your impressive carbon reduction story to staff and customers?

How do you tell the most important ‘story’ in the world? It’s a story that most ordinary citizens don’t want to think about, because it is complex and involves invisible gases. It’s the story of the amount of carbon we can “afford” to put into the atmosphere, taking account of where it might go and what it might do.

Locally owned renewable energy sources can provide multiple benefits. But how do you get local people to invest? A key driver is the net reduction in the local carbon footprint but that involves complex numbers and data. This is where our data visualisation techniques can be useful. Particularly if combined with drone photography.

How do you visualise climate reparations? That was the question we were asked last year by researchers investigating potential annual reparations to compensate those communities around the world most damaged by climate change.

It’s time to celebrate when an iconic vehicle like the London black cab goes green. Since its launch in 2018 the TX electric cab has prevented more than 200,000 tonnes of CO2 emissions from entering the earth's atmosphere. So we were happy to make a short film for the London Electric Vehicle Company (LEVC) to get across this good news story.

Dedicated people around the world are addressing local needs related to environmental stewardship and sustainability. But many also want to find a way to educate local leaders not just about the consequences of the climate crisis, but also the need for local climate action. This often means turning local carbon data into stories and imagery that people can relate to…
GLOBAL
A range of our projects highlighting global emissions and the sources of those emissions over the years.
The ocean is like a giant sponge, storing sixteen times as much carbon as all the plants on the planet. Technologies are now emerging that use the ocean to actively remove CO2 from the air and help maintain planetary temperature. But how do you communicate the issues, the complex chemistry and scale to people in coastal communities who will be impacted by these technologies?
How do you tell the most important ‘story’ in the world? It’s a story that most ordinary citizens don’t want to think about, because it is complex and involves invisible gases. It’s the story of the amount of carbon we can “afford” to put into the atmosphere, taking account of where it might go and what it might do.
How do you visualise climate reparations? That was the question we were asked last year by researchers investigating potential annual reparations to compensate those communities around the world most damaged by climate change.

Electric vehicles are at the heart of the clean energy transition. But as prices reduce and manufacturers increase their model line ups where are the raw materials needed to produce rapidly increasing volumes of EVs going to come from?

The global cement / concrete supply chain currently produces a disproportionate amount of greenhouse gas emissions. Innovative solutions that make cement and concrete production and usage sustainable are urgently needed. But how do you bring together different technology, finance and academic stakeholders to rapidly reduce those emissions?

The world is waking up to the climate crisis. Children are protesting and Extinction Rebellion has gone global. But many people are still unaware of the carbon emissions associated with everyday activities. That’s why we have teamed up with innovative multi-media theatre company Forkbeard Fantasy to see if humour could help.

State-owned and multinational businesses have continued to expand their fossil fuel extraction operations since 1965 despite being aware of the industry’s devastating impact on the planet. In this 20 second film we show what 480bn tonnes of carbon dioxide equivalent (GtCO₂e) looks like.

A film that shows in real time the current rate of global CO2 production - a million tons every thirteen minutes - as well as the reductions needed by 2030 and 2050 to meet the Paris climate target. The film was shown at the 44th G7 summit in Charlevoix, Quebec, Canada in June 2018.

We created digital campaign resources for UNEP to celebrate 30 years of international effort to protect the ozone layer. A key film highlights the dangerous global warming potential of replacement gases, and the 135 billion tonnes of CO2e that the Montreal Protocol has kept out of the atmosphere.

We made this high budget film to show actual quantities of the current global fossil fuel consumption and carbon emissions. It was shown to world leaders, industry experts, campaigners and scientists at the UN Climate Summit, New York, September 2014 to catalyse and inform conversations about reducing carbon emissions. Jump to the fossil fuel extract here.

Watch a car explode into pieces! The film dramatically shows the current and expected resource use and parking spaces required for all the world’s cars. It also shows the carbon emissions of cars today and what those would be in 2050.
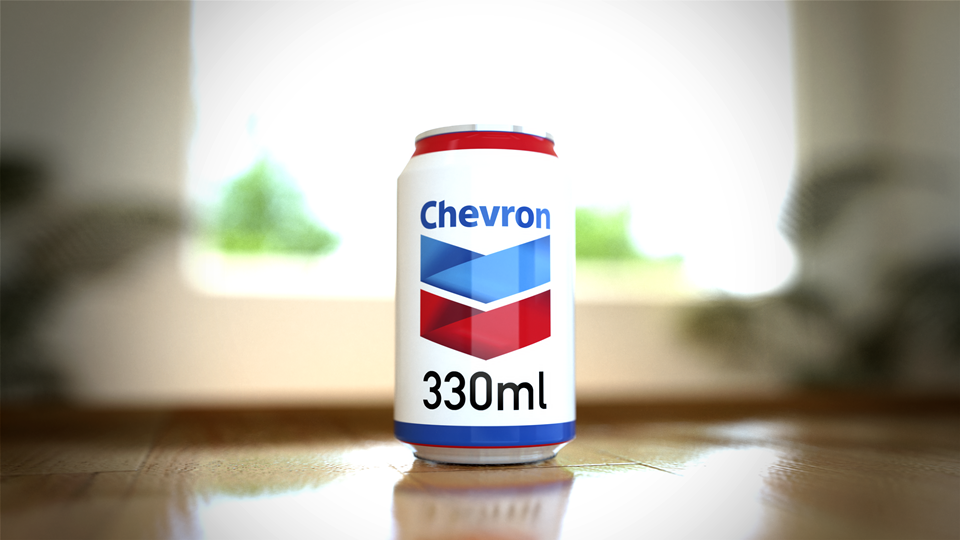
We created a range of striking graphic images to highlight the institutions responsible for extracting the oil, coal and gas that’s causing warming of the planet. This included drink cans part-filled with carbon dioxide gas to show by volume precisely how much is in a typical small room as a consequence of these companies’ extractions.
COUNTRIES & CITIES
Projects where countries are monitoring and publishing their own emissions, or committing to reduction targets that at the time seem challenging.
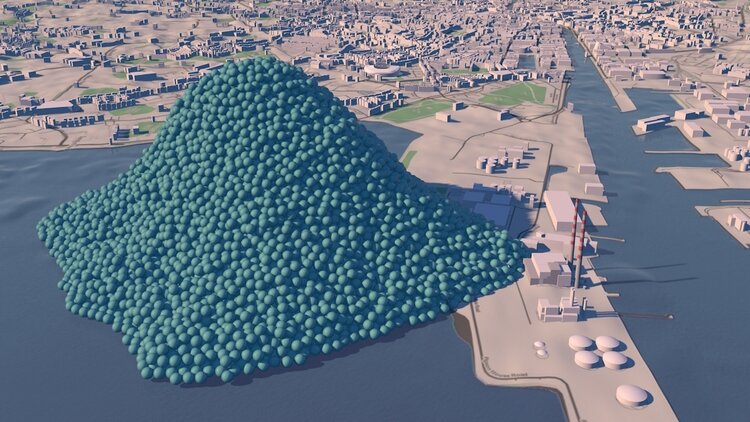
Ireland's Environmental Protection Agency (EPA) wanted simple visuals to show the country’s carbon footprint. We created a short animation showing the daily emissions in Dublin bay to inform and engage a wide range of audiences, from policymakers to the general public.
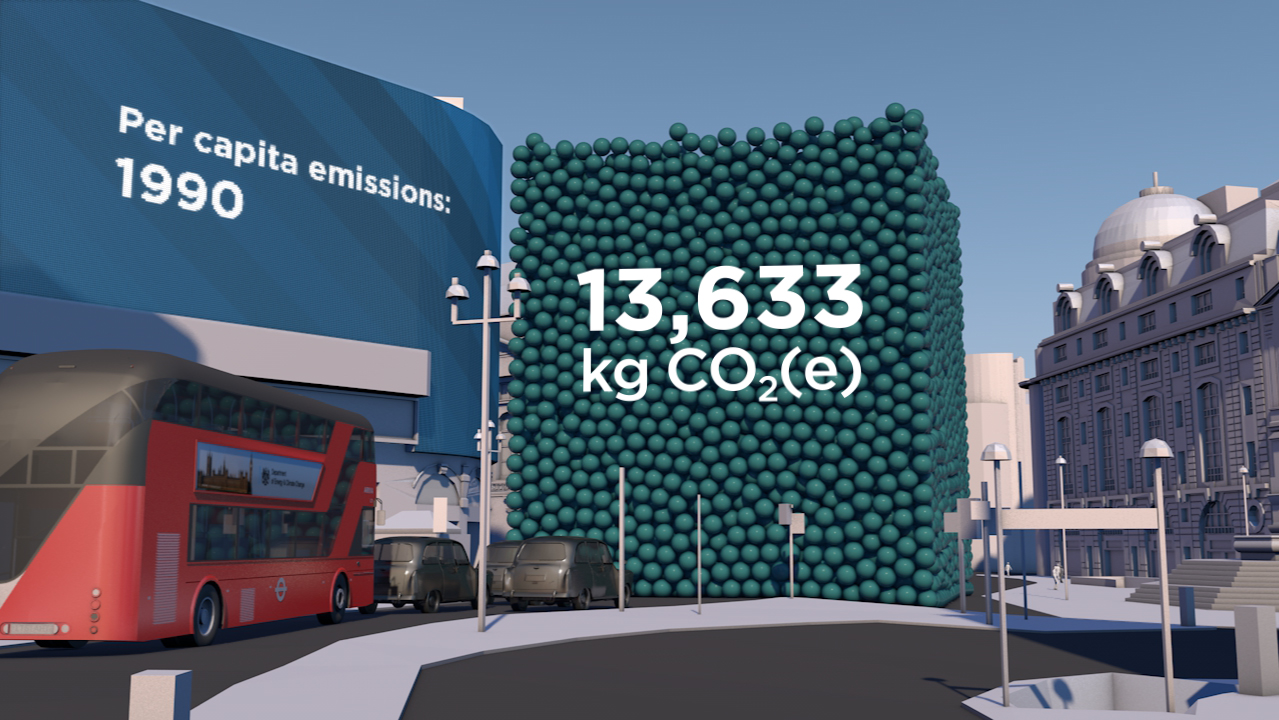
This simple animation was created to highlight the UK Government’s 2050 carbon reduction target of 80%. By using Piccadilly Circus and shifting the scale to that of a single person we were able to create a stir on social media about a 70 page Report.

Our 2012 award-winning three minute animated film shows the carbon emissions of New York City. Featured by over 100 media organisations including Scientific American, Mashable, New Scientist and Daily Mail Online the film does not even mention climate change. Yet it’s been viewed over 380,000 times on YouTube.

The carbon dioxide emissions of the USA in 2014 - 6,870 million metric tons - makes up about 14% of global emissions. This image set shows that amount as a daily pile of spheres / bubbles in Washington DC, cascading over The White House.
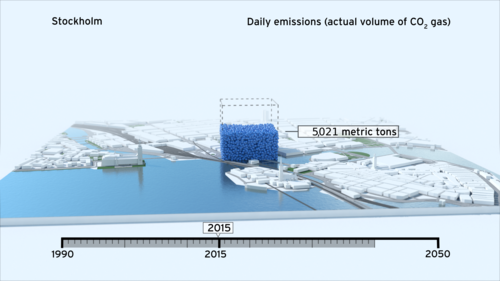
A selection of projects that we worked on for COP21, the Paris Climate Change meeting. We created short animations to show carbon reduction targets in a selection of global cities, and much more…

Staff at PwC UK have come in to work to see that a giant 10 metre diameter CO2 ‘bubble’ has appeared in the atrium of their London head office. In addition a complimentary 90 second film shows how the bubble arrived in this unusual setting.
ORGANISATIONS, PRODUCTS & SERVICES
Examples of smart organisations wanting to highlight low or zero-carbon activities, products and services.
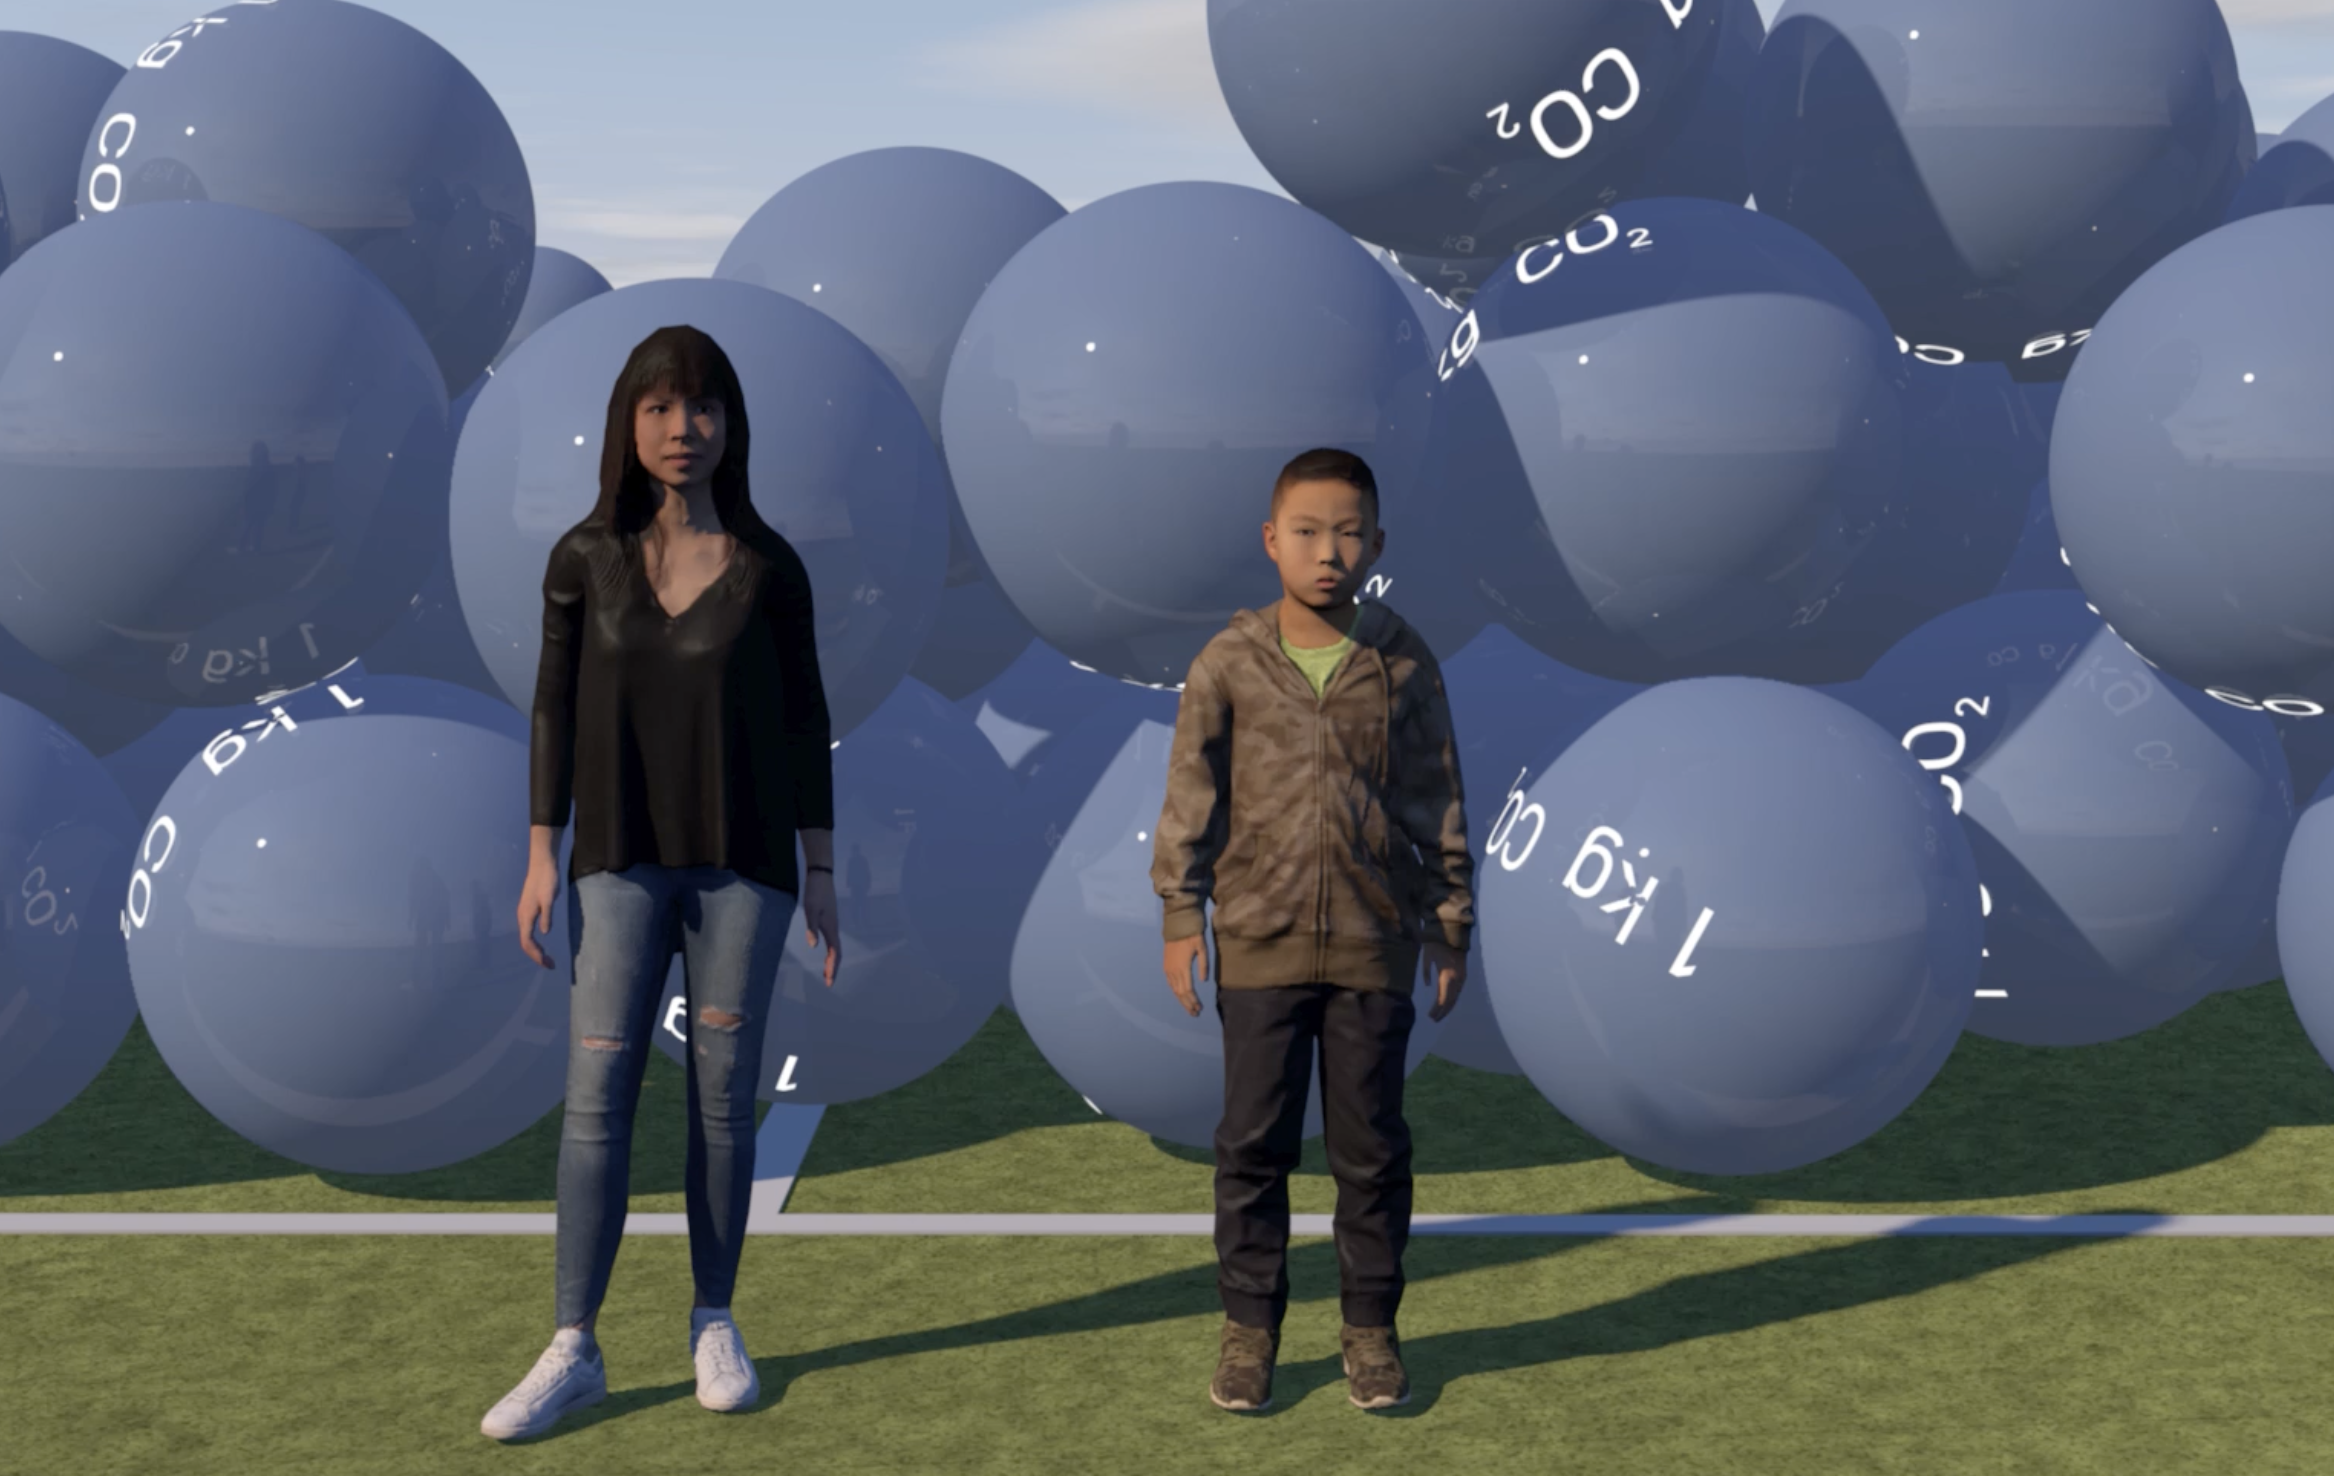
How can we engage children in the climate crisis and the role played by carbon dioxide in a way that makes it personal and real? One option is to use the energy (and thus carbon) data of the school itself to provide insight and learning.
Carbon emissions are invisible. So if you’re a major property business how do you communicate your impressive carbon reduction story to staff and customers?
Locally owned renewable energy sources can provide multiple benefits. But how do you get local people to invest? A key driver is the net reduction in the local carbon footprint but that involves complex numbers and data. This is where our data visualisation techniques can be useful. Particularly if combined with drone photography.
It’s time to celebrate when an iconic vehicle like the London black cab goes green. Since its launch in 2018 the TX electric cab has prevented more than 200,000 tonnes of CO2 emissions from entering the earth's atmosphere. So we were happy to make a short film for the London Electric Vehicle Company (LEVC) to get across this good news story.
Dedicated people around the world are addressing local needs related to environmental stewardship and sustainability. But many also want to find a way to educate local leaders not just about the consequences of the climate crisis, but also the need for local climate action. This often means turning local carbon data into stories and imagery that people can relate to…

Most people who live in or near Los Angeles know the size of the SoFi Stadium. So overfilling the stadium with giant CO2 balls seemed like a good way of helping tell a carbon story for a local freight forwarding company.

Carbon stories often make more sense if grounded in a particular place and we therefore like using iconic buildings or landmarks to give a sense of scale. So when we were approached by an organisation based in Blackpool we naturally suggested using using the Blackpool Tower.

How can global car manufacturers show climate change leadership? Phasing out petrol and diesel vehicles alone is not enough as making electric cars uses a lot of energy, particularly in the manufacture of the batteries. So the challenge is to engage with the supply chain and get them also to reduce emissions - primarily by only using renewable electricity.

How do you highlight the climate benefits of using electric bikes and e-scooters in cities? This was the challenge set by Beam Mobility, the largest micro-mobility operator in the Asia Pacific region.

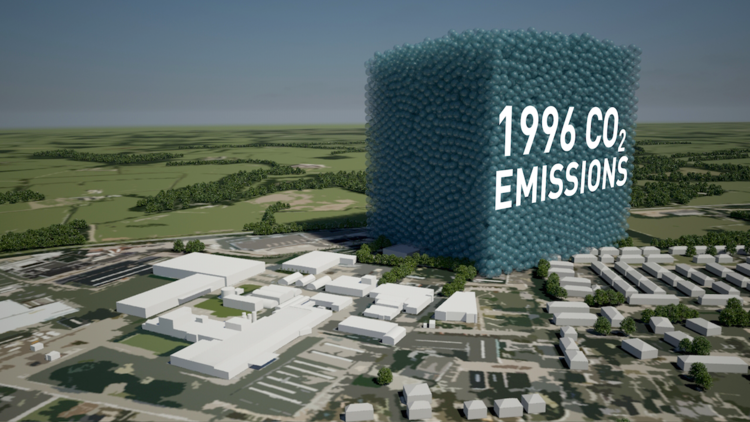
How do you demonstrate a 90% carbon reduction? We provided a short animation to show this impressive 90% achievement at the European manufacturing facility of Interface, the carpet tile manufacturer and pioneer in corporate sustainability.

How do you visualise carbon offsetting for a consumer product? This animation was created to demonstrate that although the amount of CO2 offset for a single one litre pack of engine oil might be small, it adds up. Particularly when seen from the point of view of a whole country, or indeed world sales.
NATURE
These projects highlight carbon sequestration and other issues in forests, soils and oceans.

We often inhabit places without knowing how our activities shape the natural landscape. So map-based stories that visualise what is happening beneath our feet and in the air around us can be helpful. These two videos for Somerset Wildlife Trust are good examples.

In 2014 we made a video set for Wood for Good, the UK timber industry’s promotional campaign, showing the carbon benefits of using wood and timber in the UK construction sector. The brief, eight years later, was to make shorter versions of the films suitable for educational use and social media sharing

Primary ‘old growth’ forests are unique and irreplaceable. But how do you get that message across to governments, policymakers and corporations? And the message that not all forests are the same?

Dartmoor is a wild peatland landscape in Devon, England, know for its wild horses and sheep that wander freely. This animated slideshow illustrates the amount of carbon that is ‘sequestered’ by the peat and shows the importance of these landscapes as natural carbon stores.

We think of estuaries primarily in terms of nature and wildlife. But estuaries also provide important ecosystem services, for instance the saltmarsh sequesters and stores carbon dioxide from the atmosphere. Communicating this to the public is a challenge, but we wanted to have a go…

How much carbon is stored in a tree? How does that translate into cut timber and wood products? And how much carbon can be ‘banked’ by using timber for building houses? This communication project showed the carbon benefits of using wood and timber in the UK construction sector.
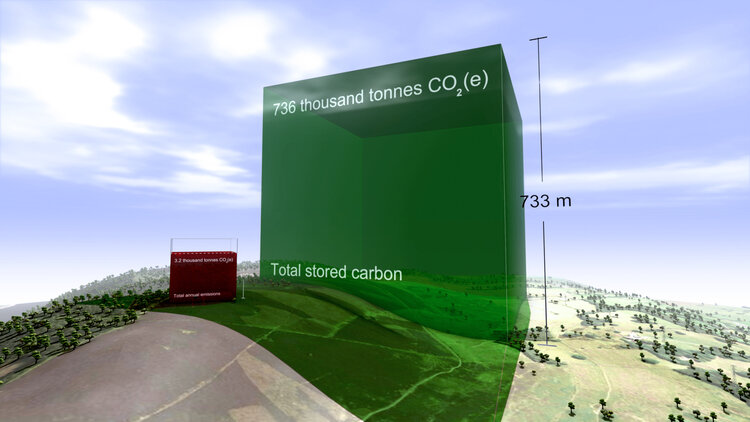
The first animation film from Carbon Visuals shows the emissions, sequestration & stored carbon on ten upland farms in the Peak District National Park, UK. The core message is that these farms are performing an important role as guardians of a huge carbon store that is best kept in soils and vegetation.
How can we engage children in the climate crisis and the role played by carbon dioxide in a way that makes it personal and real? One option is to use the energy (and thus carbon) data of the school itself to provide insight and learning.