
Ocean carbon removal - a climate solution?
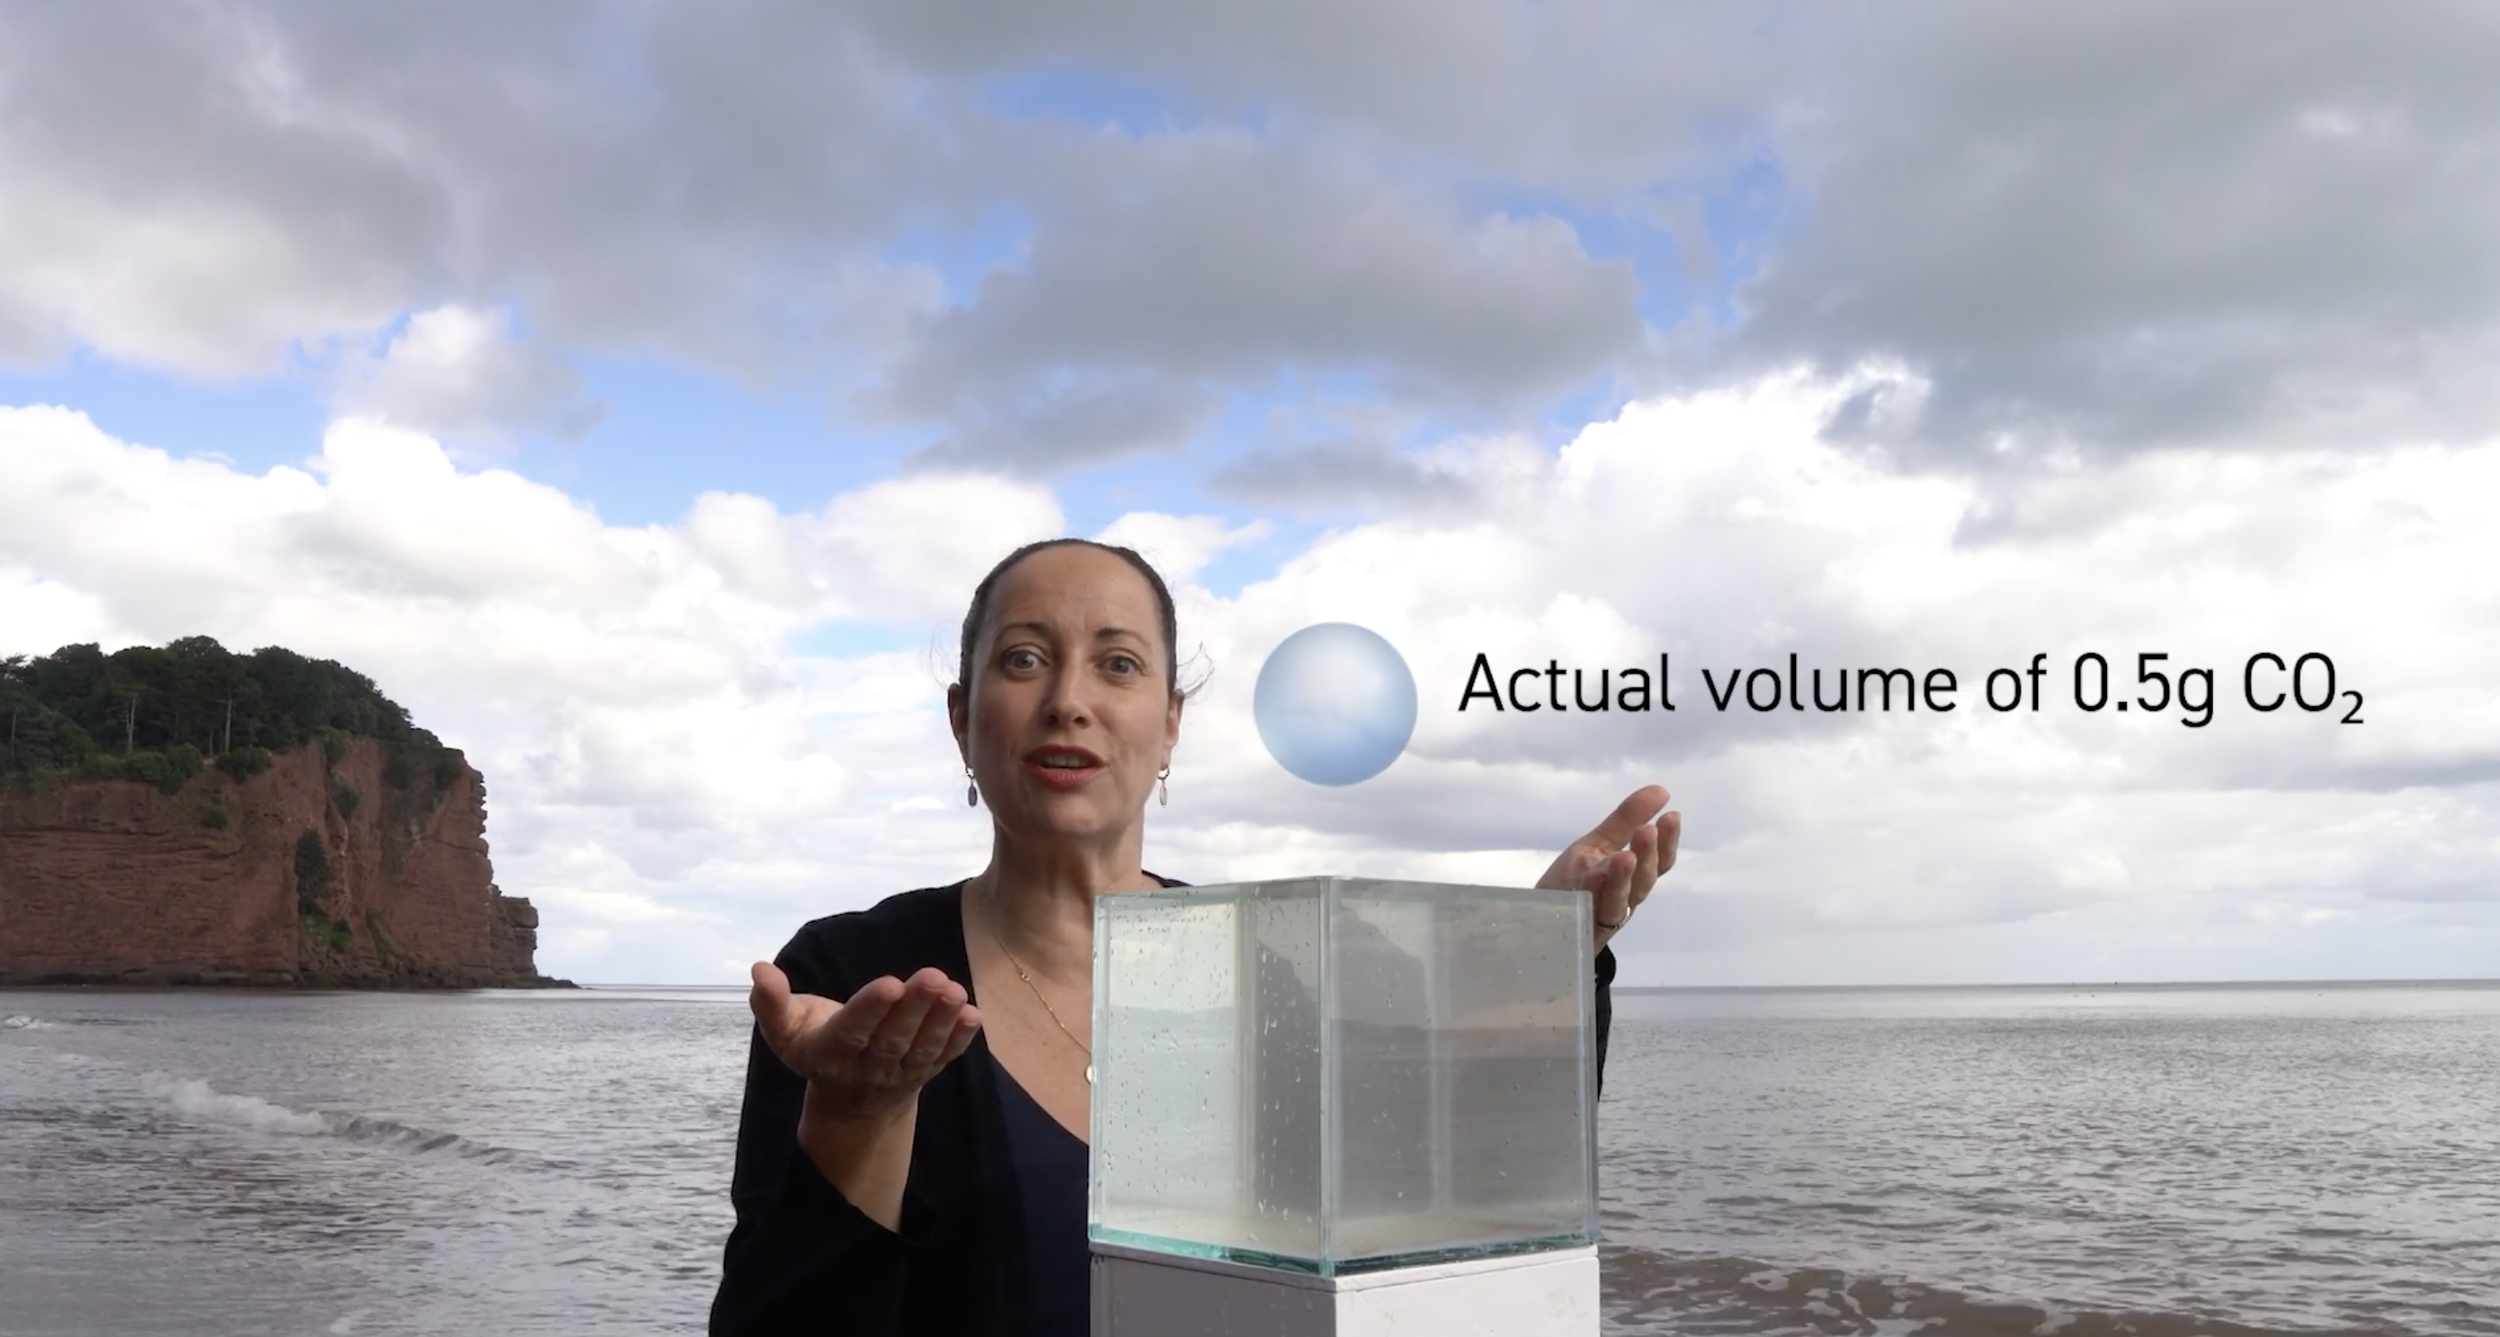
The ocean is like a giant sponge, storing sixteen times as much carbon as all the plants on the planet. Technologies are now emerging that use the ocean to actively remove CO2 from the air and help maintain planetary temperature. But how do you communicate the issues, the complex chemistry and scale to people in coastal communities who will be impacted by these technologies?
The ocean is like a giant sponge, storing sixteen times as much carbon as all the plants on the planet. Technologies are now emerging that use the ocean to actively remove CO2 from the air and help maintain planetary temperature. But how do you communicate the issues, the complex chemistry and the scale to people in coastal communities who will be impacted by these technologies?
Video explaining two marine carbon removal (CDR) approaches: ocean alkalinity enhancement (OAE) and direct ocean removal (DOR).
That was the challenge we were set by The Institute for Responsible Carbon Removal and [C]Worthy, a non profit organisation dedicated to accelerating ocean-based climate solutions and their partner the American University's Institute for Responsible Carbon Removal. They wanted our help to communicate ocean-based carbon dioxide removal strategies to engage people at a series of in-person workshops in US and Canadian coastal communities. The intention of the film is to explain the chemistry of ocean carbon removal to facilitate meaningful discussion. But it is not the intention to persuade the audience that ocean carbon removal is a good idea or right for their community.


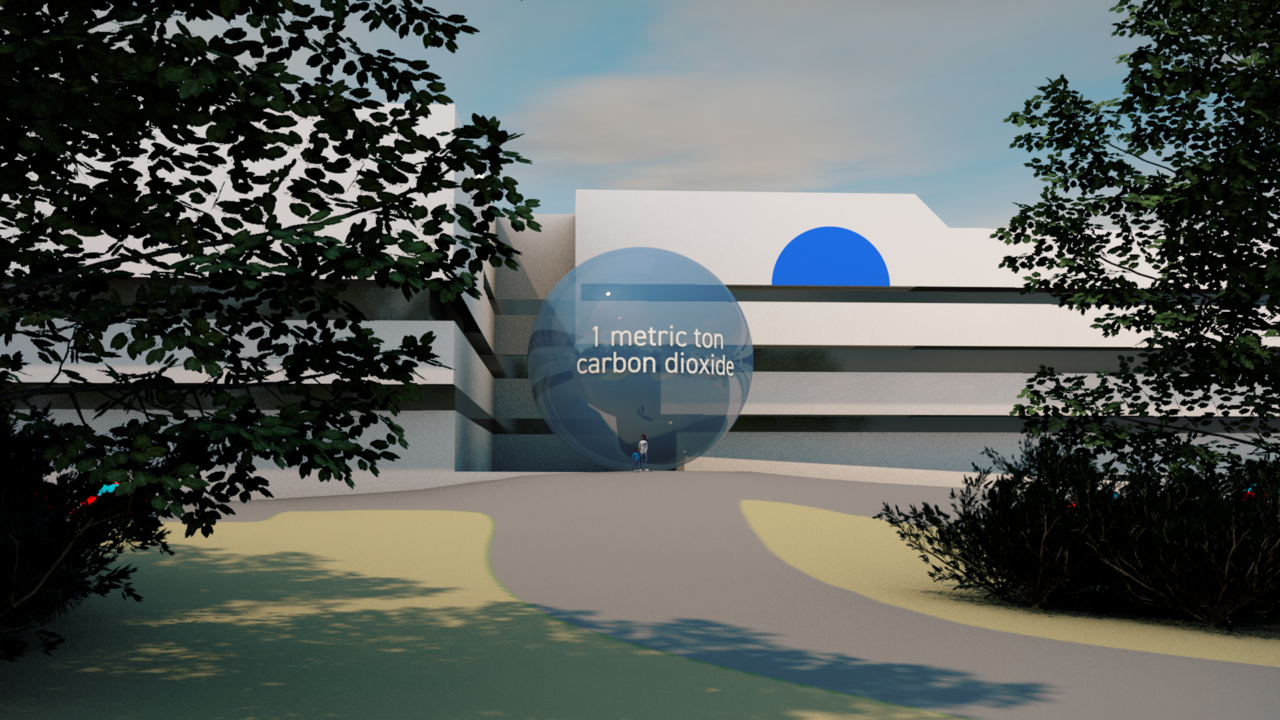
These sketches were created to show volumes of limestone chips and volume of carbon dioxide that could be removed from the atmosphere with successful large-scale ocean alkalinity enhancement.
This film was made over the summer months of 2025 with invaluable CGI assistance from Jon Feuell. The live action scene shot on Holcombe beach, Devon with Director Adam Nieman, actor Rosalind Moreno-Parra, cameraman Will Hodges and general assistant Antony Turner. The plinth and one gallon glass cube were made by Antony Turner and James McHardy.


Further information from [C]Worthy and the Institute for Responsible Carbon Removal.

Visualising $209 billion climate reparations
How do you visualise climate reparations? That was the question we were asked last year by researchers investigating potential annual reparations to compensate those communities around the world most damaged by climate change.
How do you visualise climate reparations? That was the question we were asked last year by the Climate Accountability Institute who were investigating potential annual reparations to compensate those communities around the world most damaged by climate change. The calls for climate reparations are rapidly growing in the scientific literature, among climate movements, and in the policy debate. At present the costs of climate change are primarily borne by nation states that compensate their own citizens harmed by climate impacts or covered by insurance companies with regard to people and businesses that they insure. Some countries are also now promising to contribute to the Loss and Damage Fund agreed at COP28 to compensate people in low income countries.
“Time to pay the piper: Fossil fuel companies’ reparations for climate damages” argues that a substantial responsibility for the cost of redressing climate harm lies with the companies that engage in the exploration, production, refining and distribution of oil, gas and coal. The opportunity to help communicate this story was quite a challenge, but we created a simple image based on the data in the Paper. However recently we have been wondering whether the $209 billion dollars attributed to fossil fuel companies could be better illustrated by a CGI animation. This is the result.
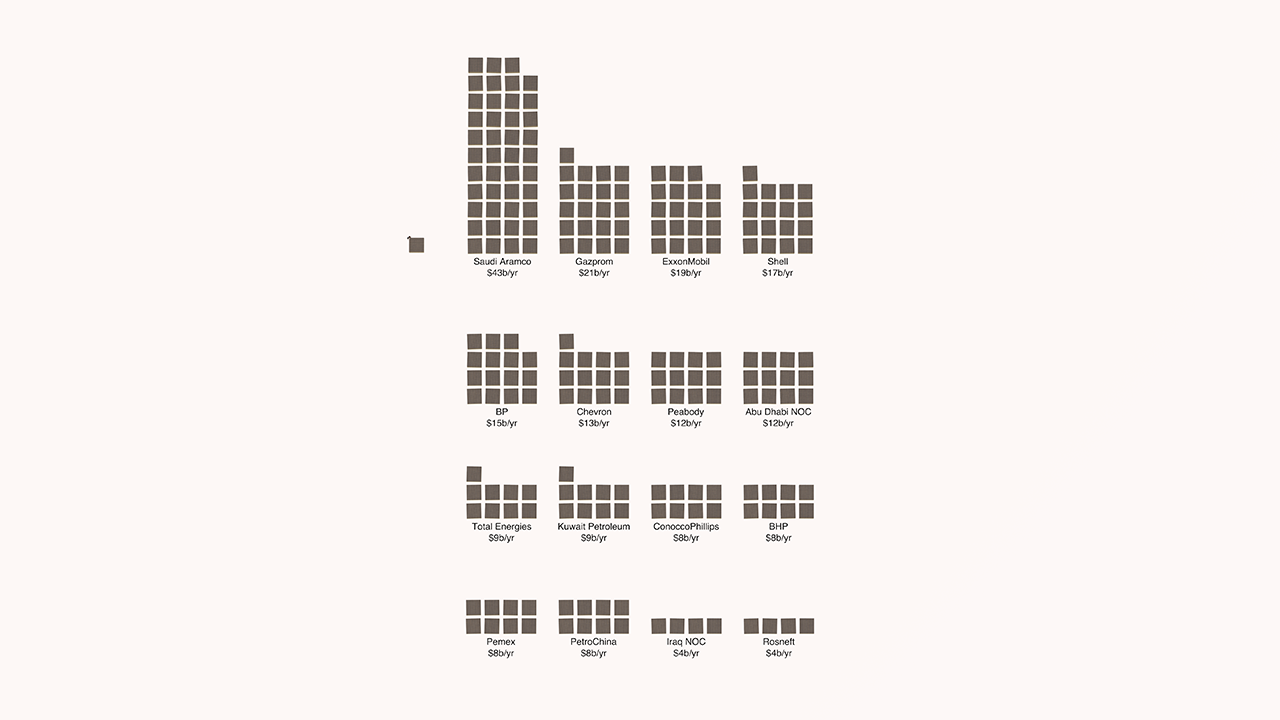
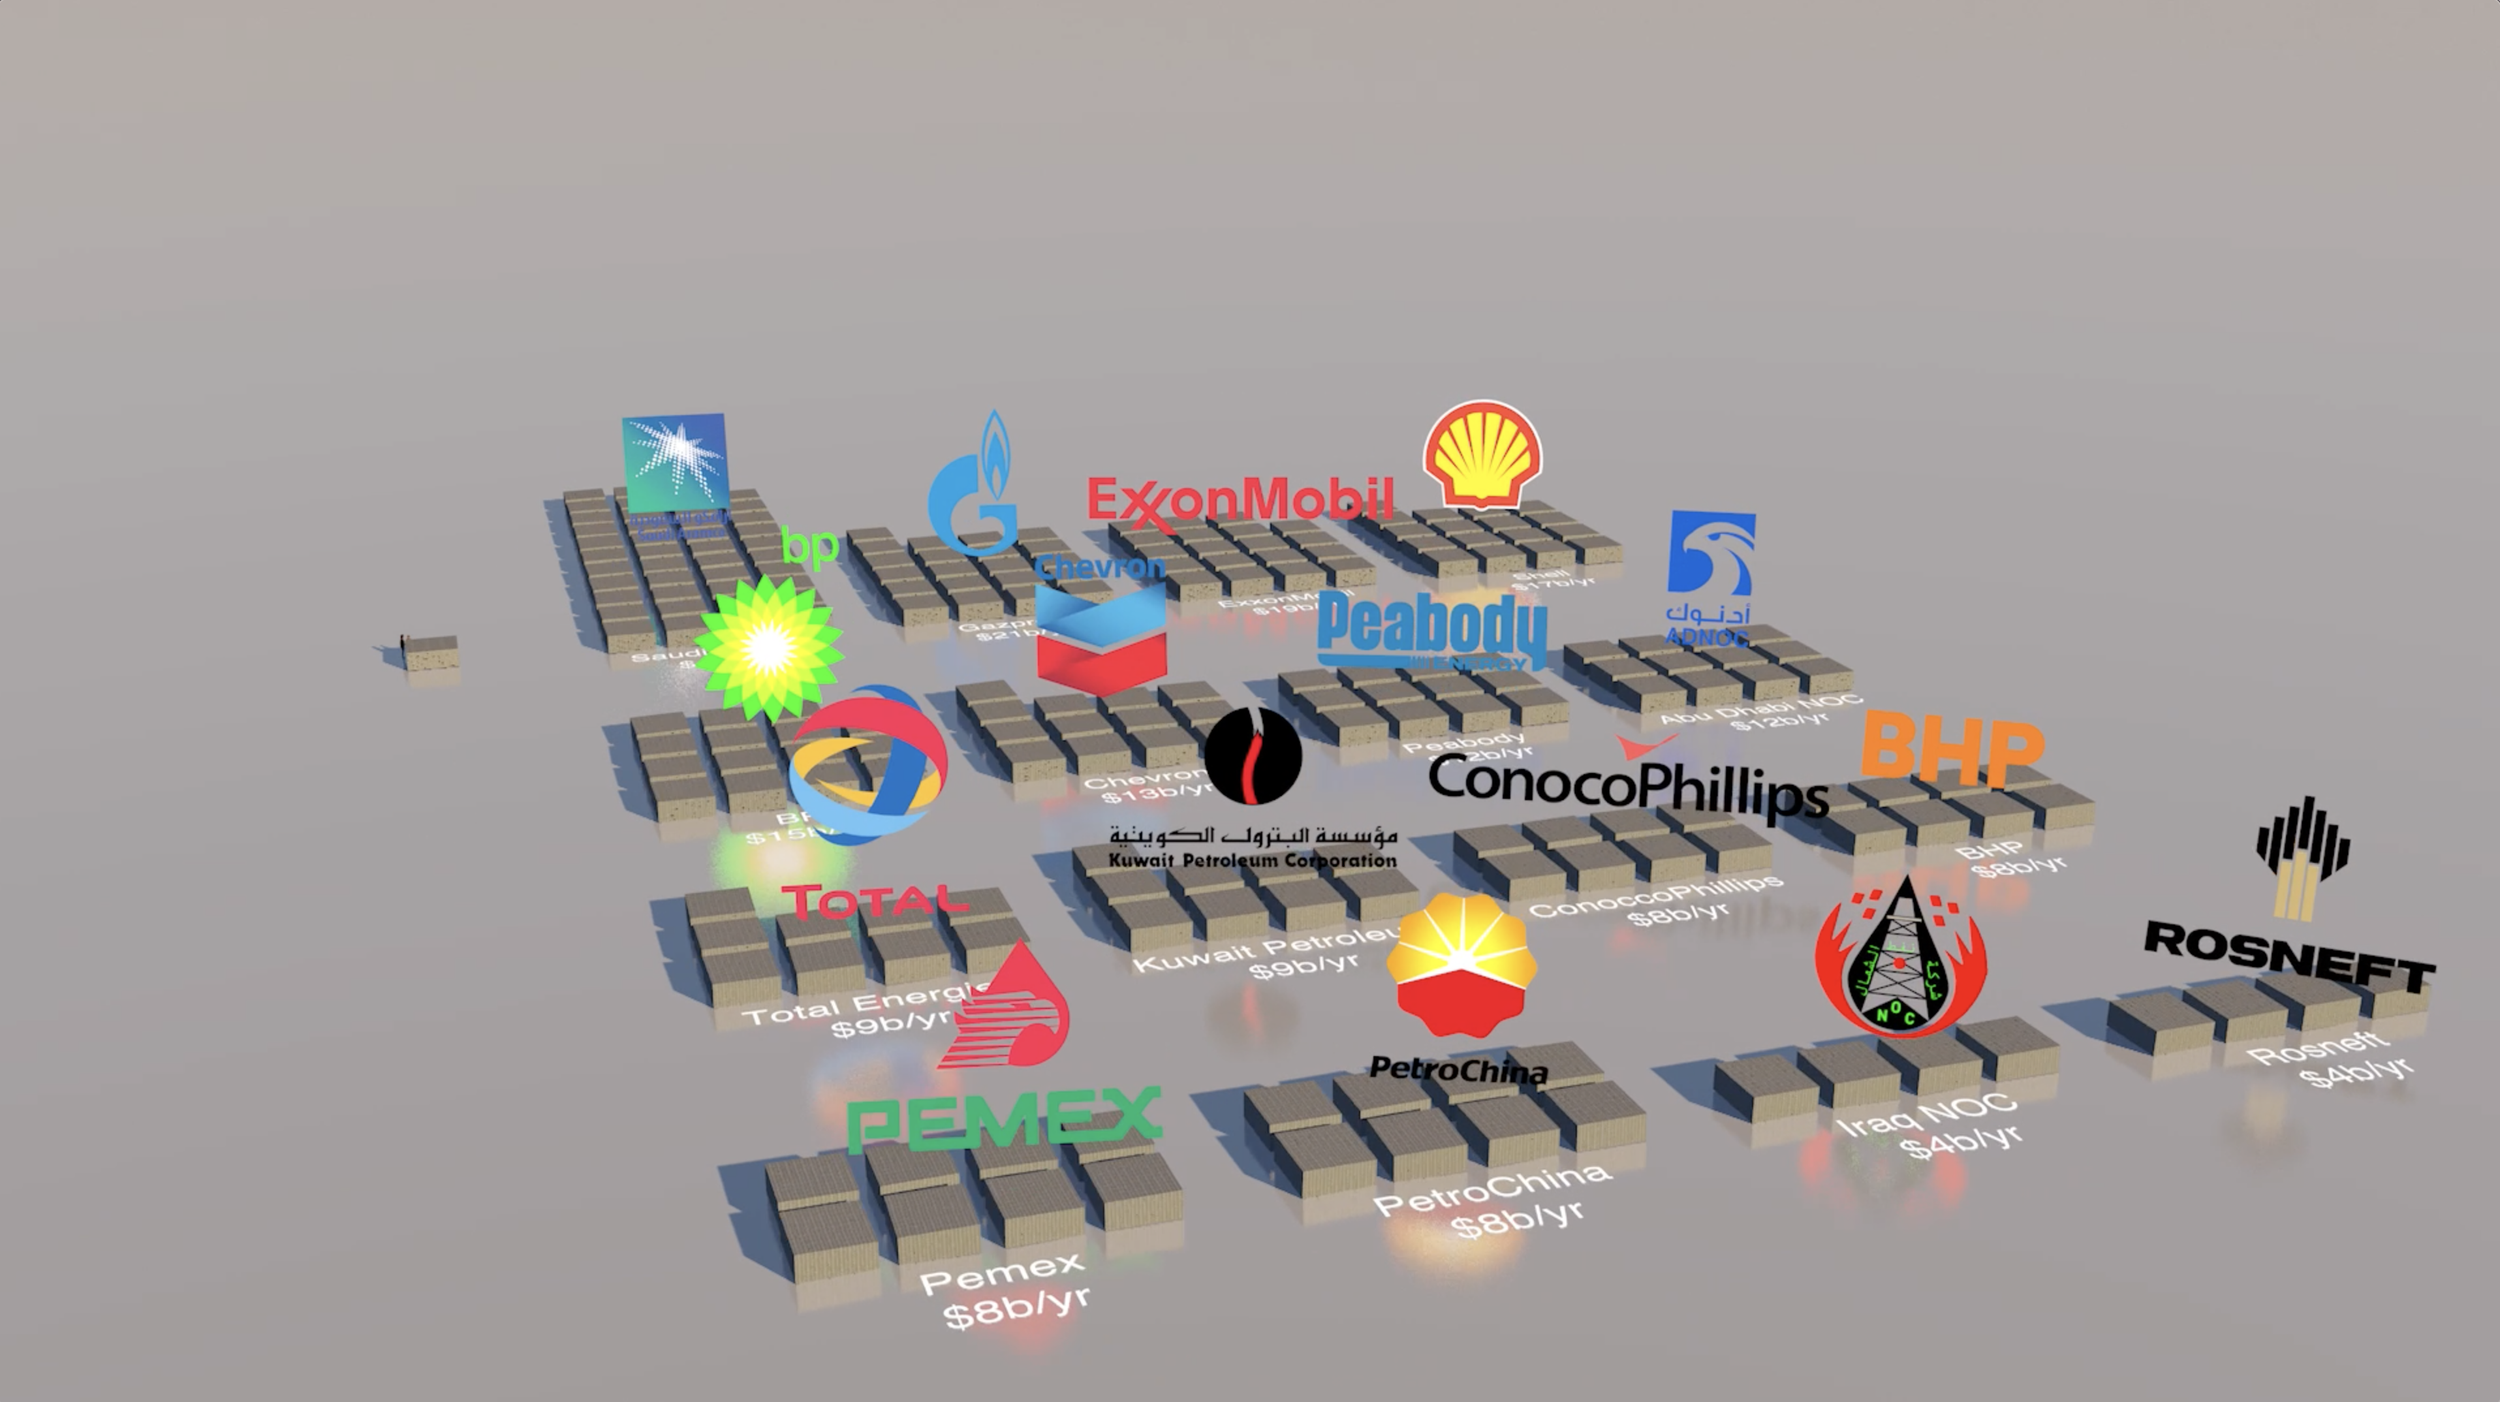
Two perspectives on annual reparations (each block is a $billion)
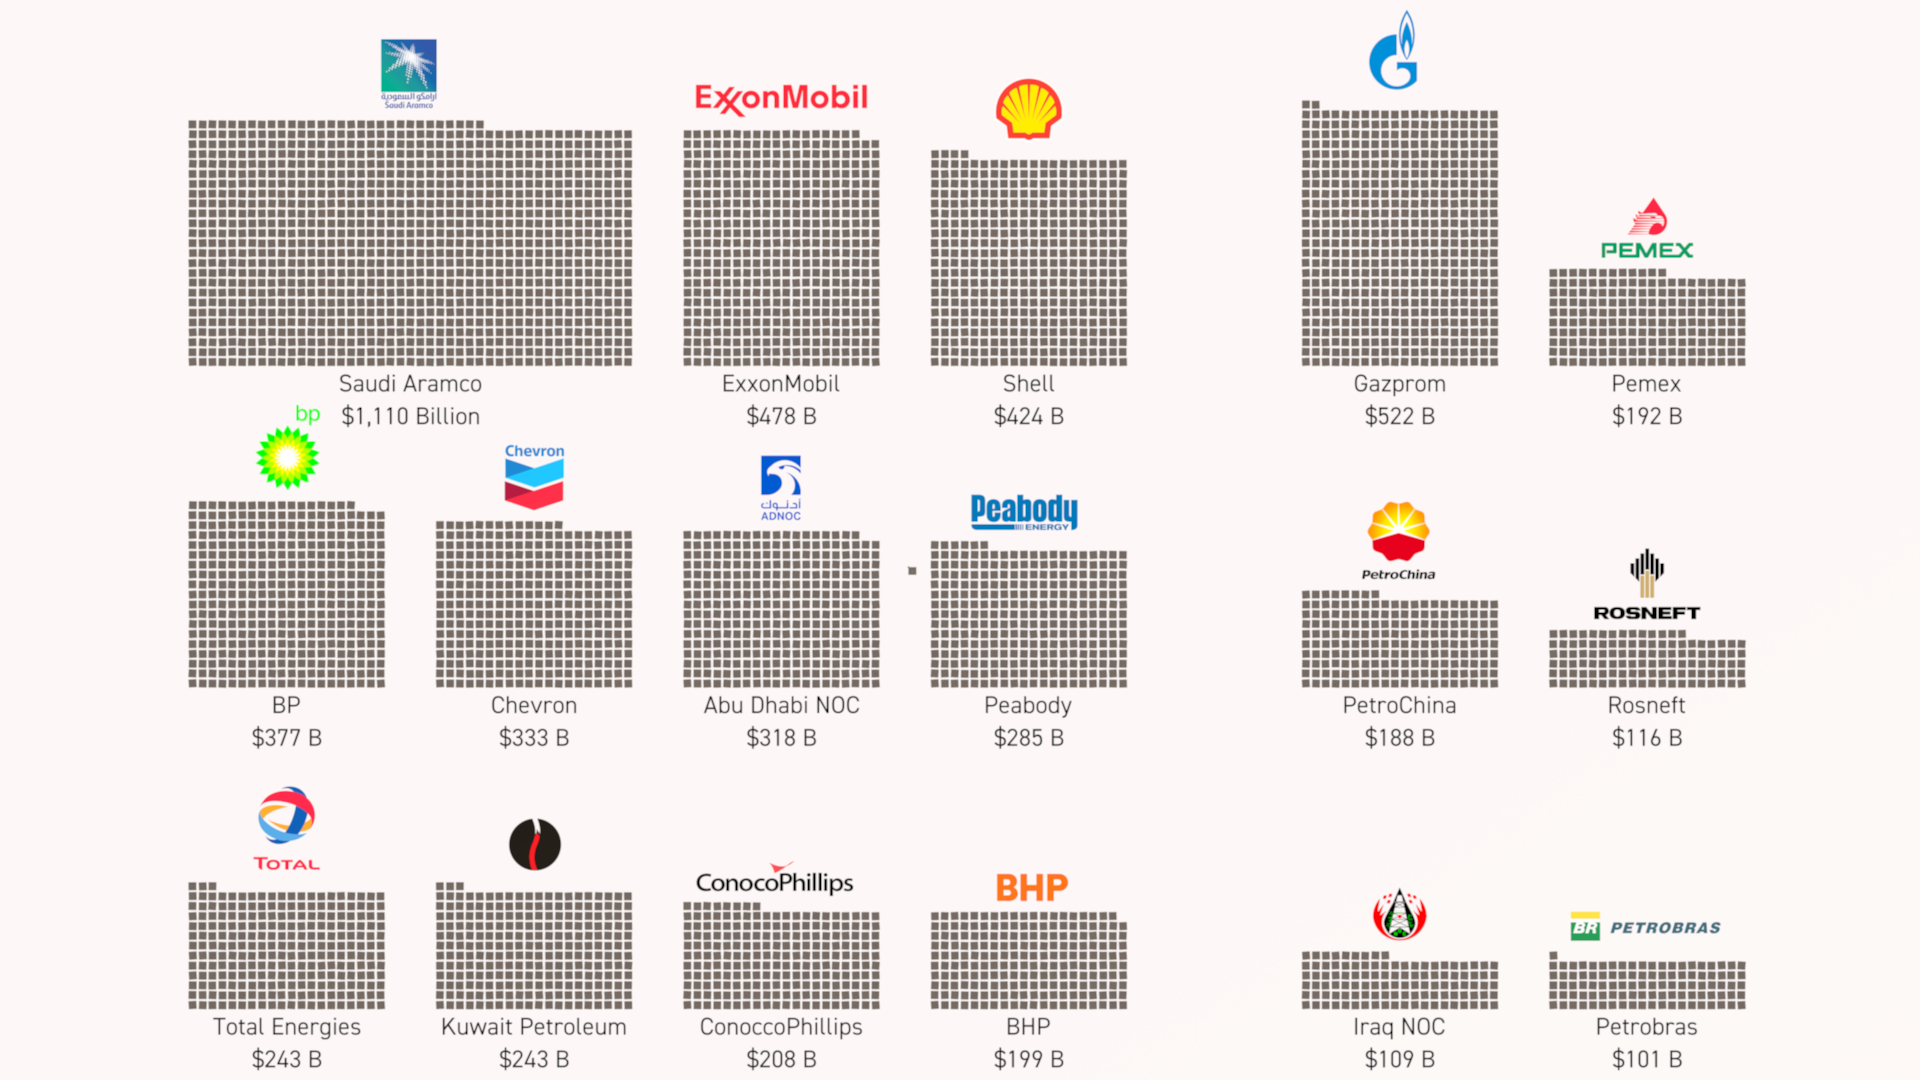
This is the simple abstract image we created for the Report’s Press Release. Each square represents a billion dollars.
“As increasingly devastating storms, floods and sea level rise bring misery to millions of people every day, questions around reparations have come to the fore.
”
Finally we thought it could be useful to create a simple version just showing what $1 billion looks like (in $100 dollar bills)
Real World Visuals is best known for creating images and animations depicting carbon dioxide emissions, savings and targets. But we have also created visuals to show a variety of ‘invisible’ challenges including air pollution, ozone, water quantities, raw materials and even unwanted Christmas gifts.
Contact us if you have a challenge communicating billions of dollars or billions of tons!

Think globally, visualise locally
Dedicated people around the world are addressing local needs related to environmental stewardship and sustainability. But many also want to find a way to educate local leaders not just about the consequences of the climate crisis, but also the need for local climate action. This often means turning local carbon data into stories and imagery that people can relate to…
Dedicated people around the world are addressing local needs related to environmental stewardship and sustainability. But many also want to find a way to educate local leaders and citizens not just about the consequences of the climate crisis, but also the need for local climate action. This often means turning local carbon data into stories and imagery that people can relate to…
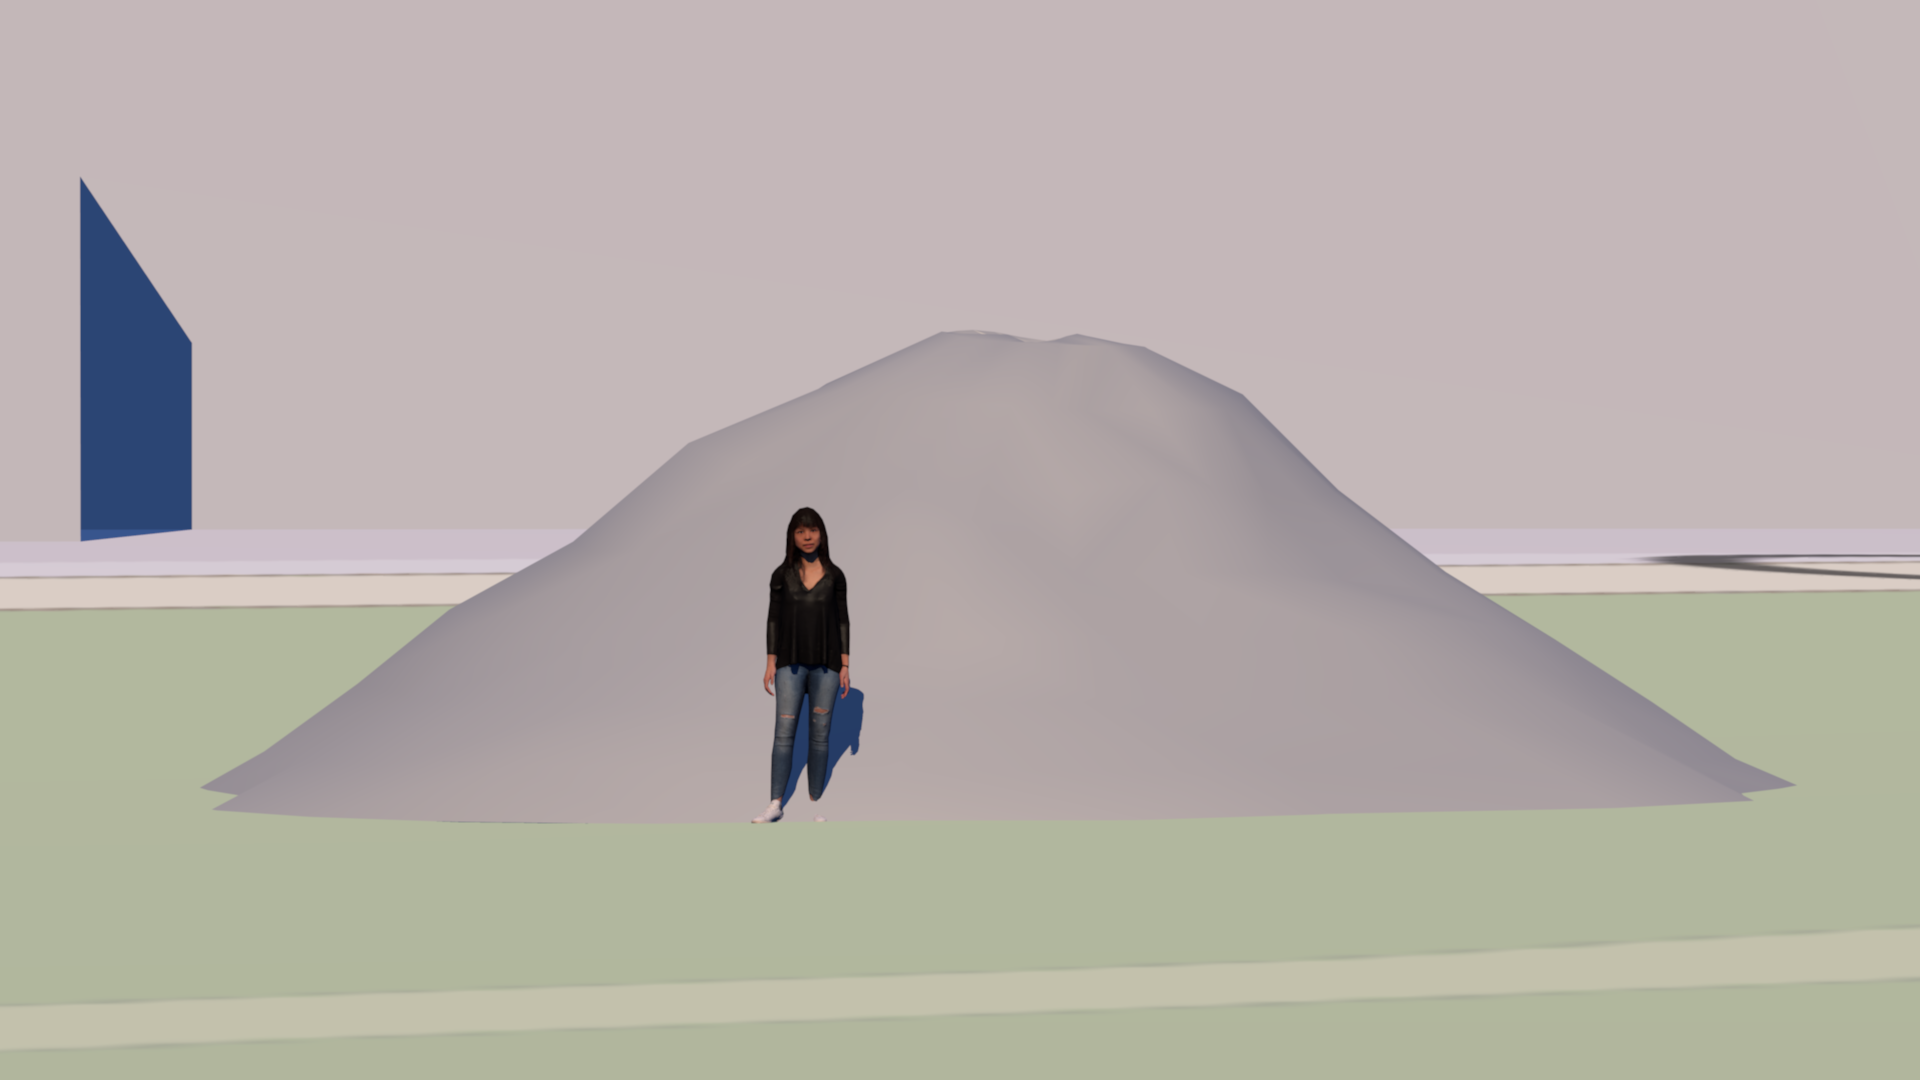
This animation was created for Emerald Keepers, a non-profit organisation in the City of Coronado, California who asked us to visualise the carbon footprint of the city. According to the City’s Climate Action Plan, daily life in Coronado and bridge traffic add 4 kg CO₂ to the atmosphere every second. (The figure does not include Navy, School District, nor Port properties.)
Emerald Keepers have over the years done a great job in building community-based programs and educational outreach. These initiatives encourage community involvement while fostering pride in the beaches, bays, and parks of their beautiful city. But they were determined to also influence the City Council to make progress on a climate action plan.
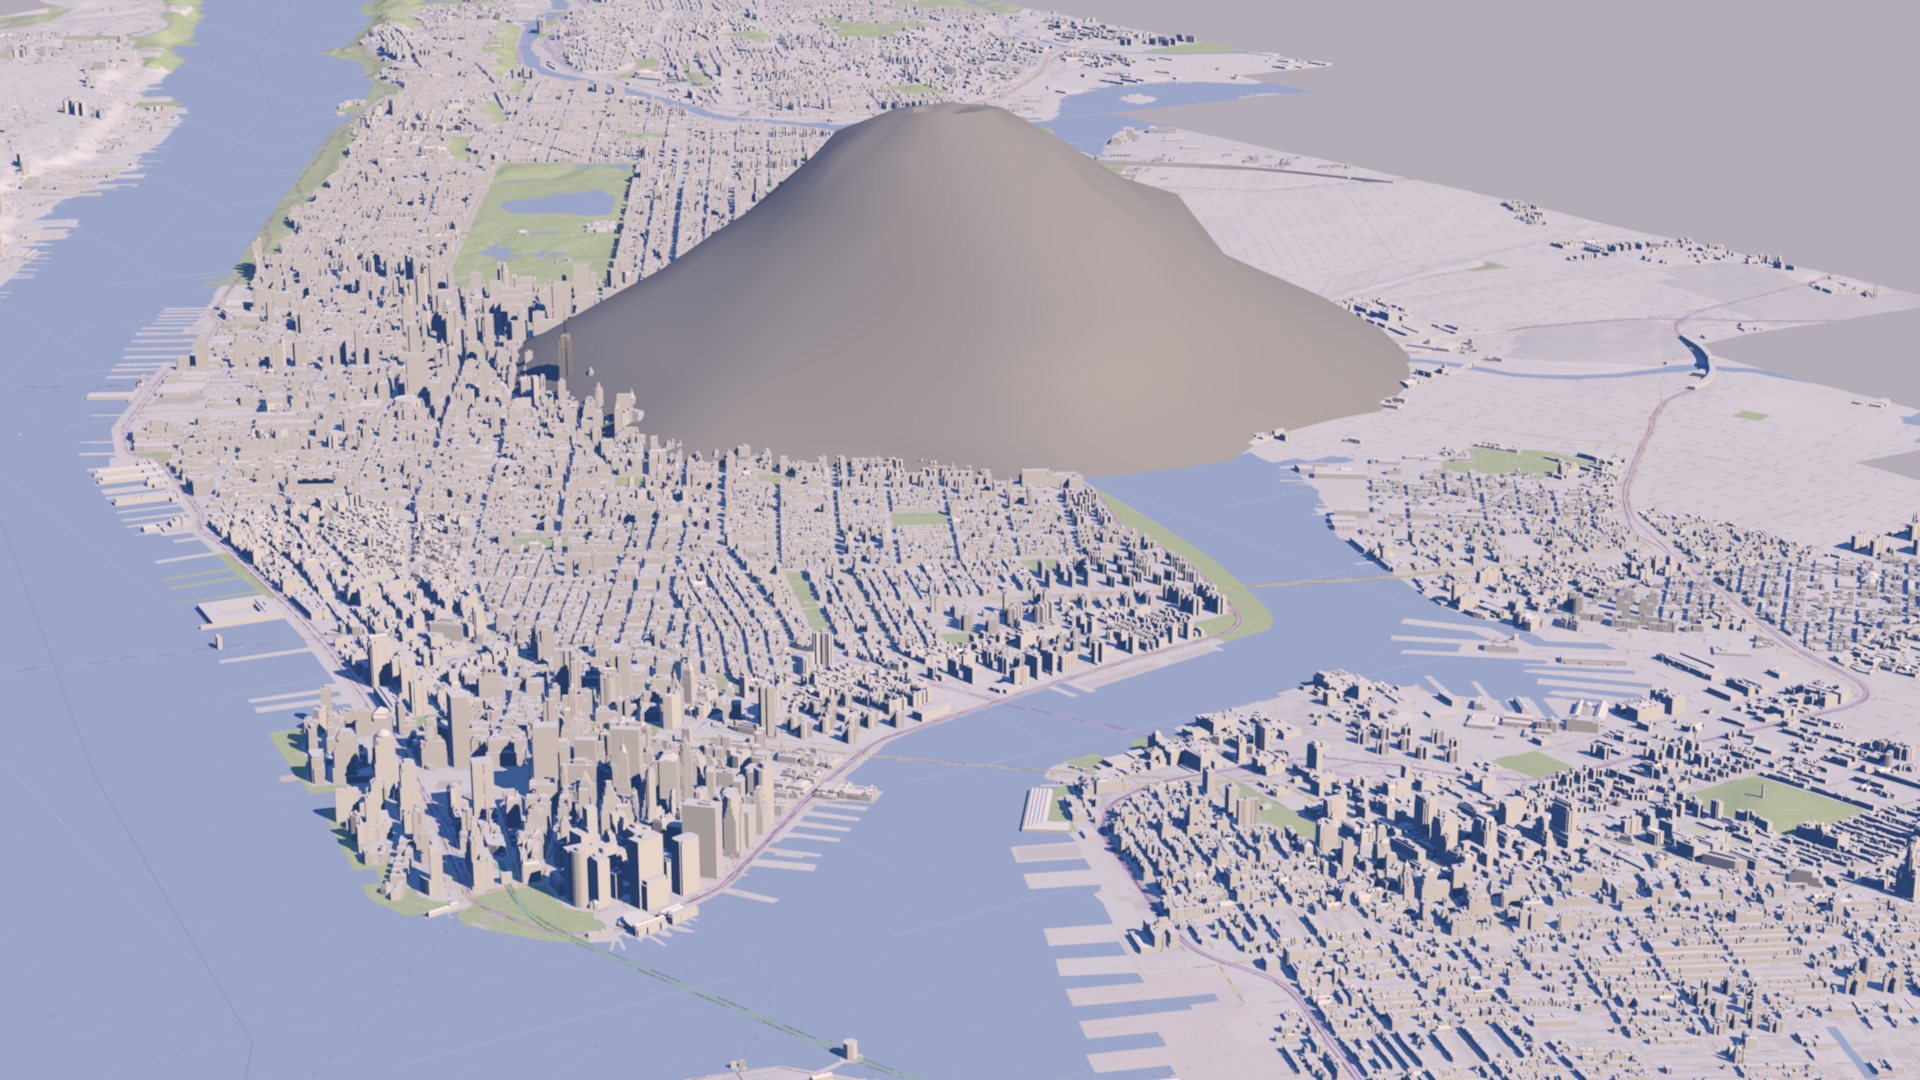
We put extra effort into creating the 3D model of Coronado because we know that boring carbon numbers ‘come alive’ by locating CO₂ ‘bubbles’ in a familiar location.
“WOW! It looks GREAT! Thanks for the extra effort. Tackling the climate crisis is not as easy as one might think but we are making progress and your video has really helped. Now I want to spread it to everyone in our city.”
“It’s been a privilege working with Amy and her team at Emerald Keepers to make this video happen. ”
Vimeo version of video here

We like filling stadiums
Most people who live in or near Los Angeles know the size of the SoFi Stadium. So overfilling the stadium with giant CO2 balls seemed like a good way of helping tell a carbon story for a local freight forwarding company.
Most people who live in or near Los Angeles know the size of the SoFi Stadium. So overfilling the stadium with giant CO2 balls seemed like a good way of helping tell a carbon story for a local freight forwarding company.
Rockit-Global are known for supporting the most legendary acts and emerging artists in their tours across the world. They wanted a short animation and image for their annual ESG Report to illustrate the carbon footprint of their domestic trucking emissions.
If you have a carbon story to tell and want to use one of the world’s iconic stadiums do get in touch.
More information on Rockit-Global’s environmental credentials here.

What’s the carbon footprint of cement?
The global cement / concrete supply chain currently produces a disproportionate amount of greenhouse gas emissions. Innovative solutions that make cement and concrete production and usage sustainable are urgently needed. But how do you bring together different technology, finance and academic stakeholders to rapidly reduce those emissions?
The global cement / concrete supply chain currently produces a disproportionate amount of greenhouse gas emissions. Innovative solutions that make cement and concrete production and usage sustainable are urgently needed. But how do you bring together different different academic, financial, and industrial stakeholders to rapidly reduce those emissions?
Real World Visuals were contacted by Pure Green Cement, a membership organisation that provides a platform to accelerate connections between stakeholders with a vested interest in climate change mitigation in the cement / concrete industry. They wanted to bring innovative ideas out of papers and labs and into real world solutions by accelerating connections between academia, industry, and the financial sector. They firmly believe that innovations needed in this industry reside in the minds of academics, and by bridging academia with necessary funding and resources, they aim to build the foundation for a greener cement industry.
We created a simple animation designed to catch the attention of academics / researchers working on carbon abatement research as well as members of the financial community looking to fund projects that mitigate climate change. The film not only shows the carbon footprint of global cement production, but it makes it ‘real’ by also showing the volumes of cement. A good example of our ‘concrete visualisation’.
“As a disproportionate CO2 emitter, the cement industry needs innovations that will reduce its carbon footprint. However, it is hard to grasp just how much cement is produced worldwide and the associated CO2 emissions by looking at numbers on paper. PGC wanted to give our audience a way to visualize these stark figures in order to demonstrate the need for emissions reductions in this vital industry, and RWV’s video has helped us achieve this.”
Data and assumptions behind this video can be found here: Data and Assumptions
Client: https://puregreencement.com

Commuting to work - what is the carbon footprint?
The Western Australia Water Corporation wanted to help employees understand the carbon footprint associated with their commuting to work.

Should commuting to work be counted as part of an organisation’s carbon footprint? Technically employee commuting is classified as indirect (Scope 3) emissions. But responsible organisations can help employees engage with the climate challenge by helping them understand their commuting carbon footprint.
The Western Australia Water Corporation did just that. They hoped to encourage employees to change commuter behaviour or offset their commuting carbon emissions. But to do that they wanted to make their emissions ‘real’, and so came to us for help.
We created a set of still images together with two short animations showing the commuting carbon emissions set next to the Water Corporation headquarters in downtown Perth. This is a good example of a simple and fast project using the in-house enhanced capabilities we have developed over last two years.
“Thank you very much for your help and great work. The story published in our intranet and internal news has had an immediate strong response. Very impactful.”

Client: www.watercorporation.com.au