

United States' daily contribution to global warming
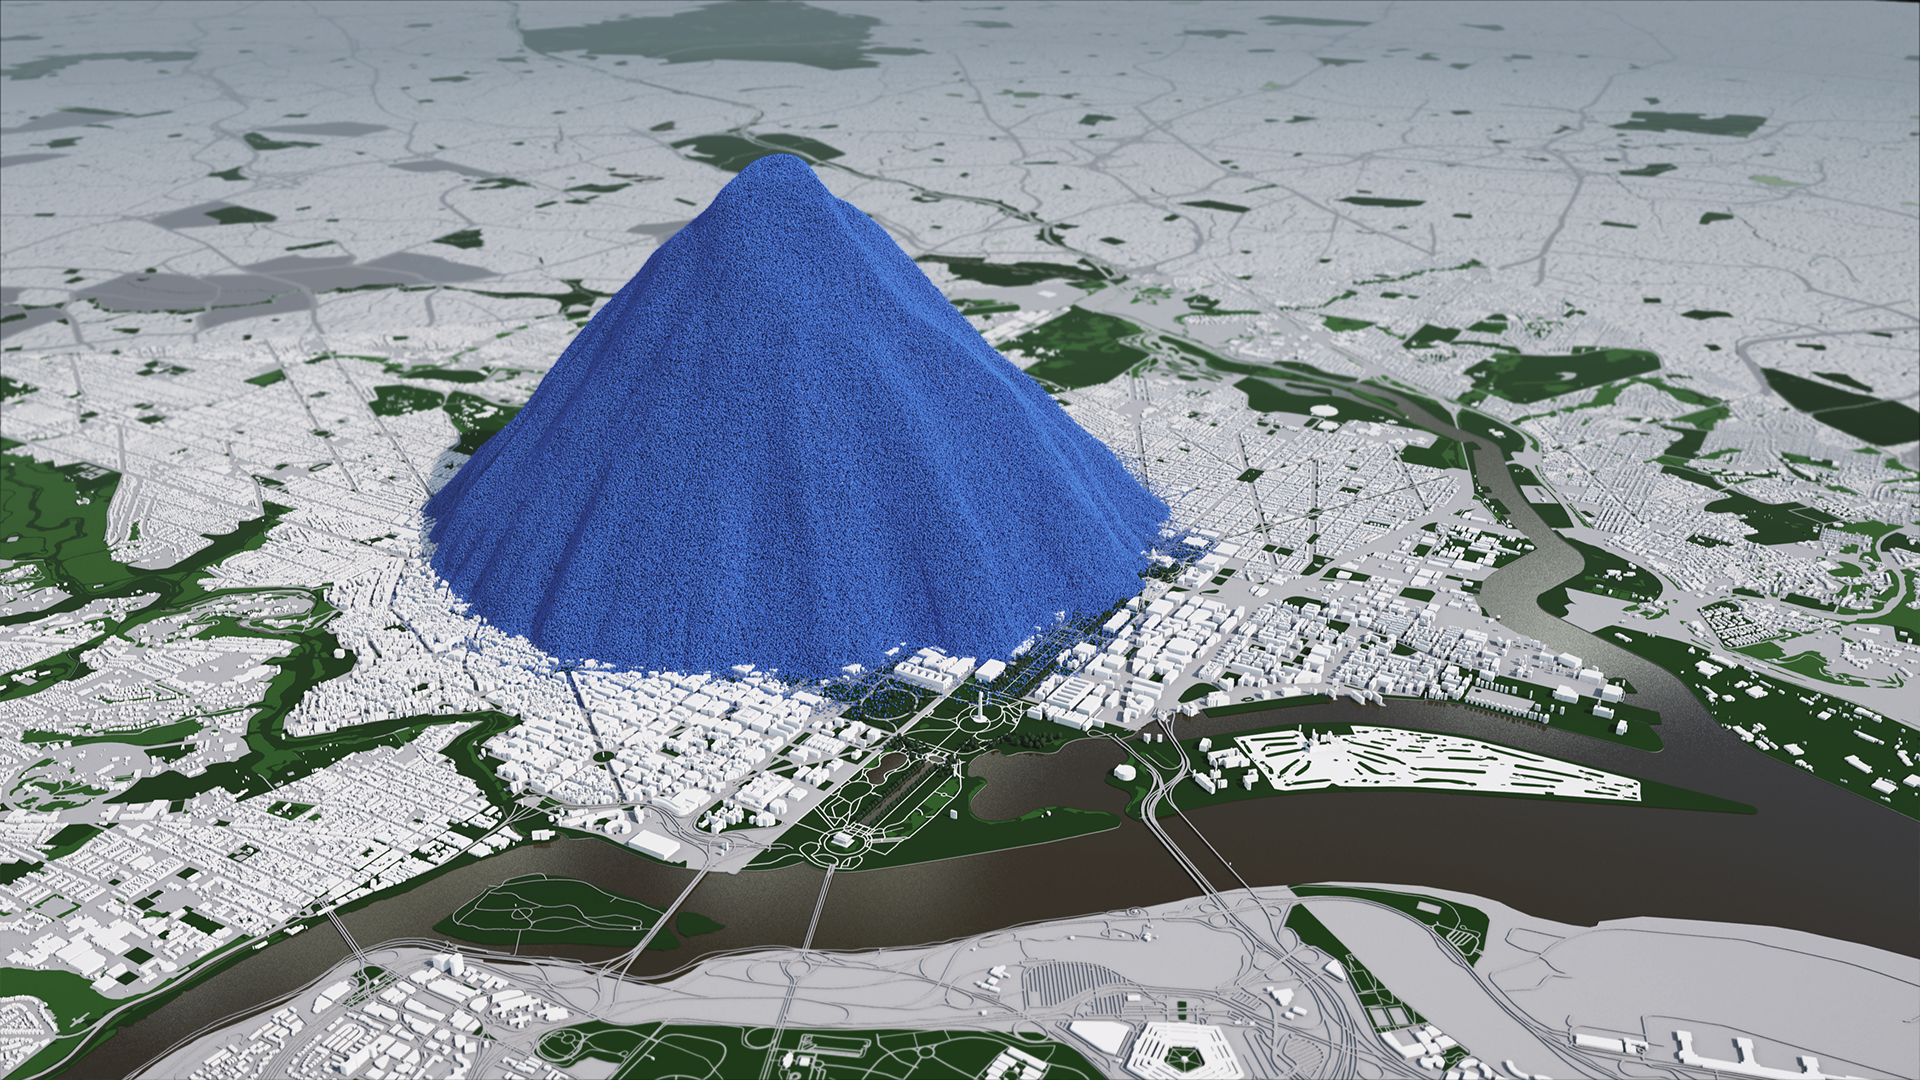
The carbon dioxide emissions of the USA in 2014 - 6,870 million metric tons - makes up about 14% of global emissions. This image set shows that amount as a daily pile of spheres / bubbles in Washington DC, cascading over The White House.
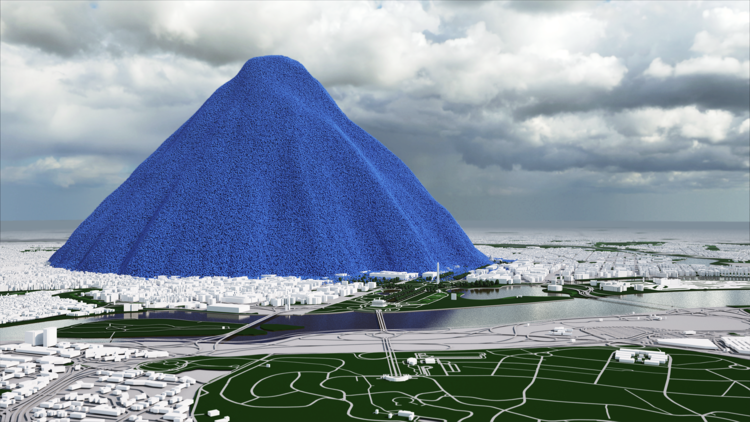
In 2014, the United States added the equivalent of 6,870,000,000 metric tons of carbon dioxide to the atmosphere * (6,870 million metric tons). On average that is:
- 218 metric tons every second
- 13 thousand metric tons every minute
- 784 thousand metric tons every hour
- 18.8 million metric tons every day
One metric ton of carbon dioxide gas would fill a sphere just over 10 metres across (33 ft) ** . To give a sense of scale to these emissions, we've made a pile of 18,809,437 one-ton spheres (US emissions for one day). The pile is 2,367 metres high (1.5 miles).


High resolution versions of these images are available with a 'Creative Commons Attribution' license from our Flickr page: US Daily CO2
To put these emissions into a global context, this image shows all the emissions from all countries in 2013. If you mouse-over the image you will see all emissions since 1750. (Note that the figures in this image are given in terms of carbon, not carbon dioxide. To convert to carbon dioxide multiply by 3.6642.)
US emissions are currently about 14% of global emissions. This film shows how much carbon dioxide the planet as a whole is adding to the atmosphere all the time.
In 2012 human activity added over 39 billion metric tons of carbon dioxide to the atmosphere, The pile of one metric ton spheres in the film, which represents one day’s global emissions, is 3.7 km high (2.3 miles) and 7.4 km across (4.6 miles).
Footnotes
* U.S. Environmental Protection Agency, 2016, Inventory of U.S. Greenhouse Gas Emissions and Sinks, Table ES-2, pp ES5-7
** At standard pressure and 15 °C (59 °F) carbon dioxide gas has a density of 1.87 kg/m3
COP21 - Seeing the Invisible
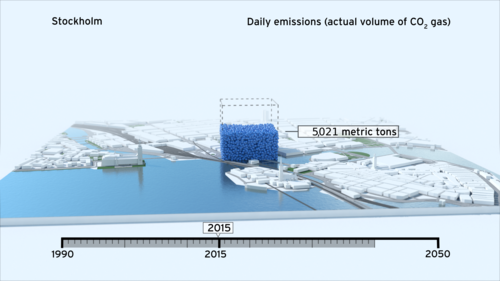
A selection of projects that we worked on for COP21, the Paris Climate Change meeting. We created short animations to show carbon reduction targets in a selection of global cities, and much more…
The outcome of COP21 extends well beyond national governments and those with a seat at the table at the events themselves. This is about people around the world ‘getting it’ including staff in companies, the data crunchers who analyse the impact of changing CO2 levels and the person on the street feeling informed enough to make the difference through their domestic choices.
For six years, we have been working with organisations to show that if you can see carbon dioxide you do something about it. Recently we have been supporting several organisations in their preparation for COP21.
In our experience, the informed engagement of people everywhere supports the actions of our leaders and decision makers during and after these conferences. The impact of a team of people, a community, or a nation who ‘get it’ means that the agreements reached at COP21 actually become real.
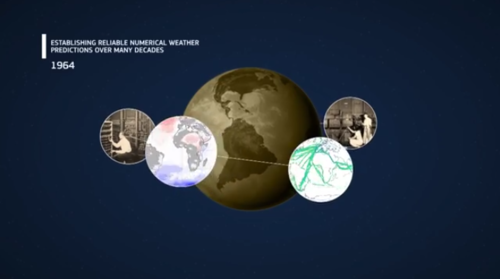
For a COP21 event we created short animations to show carbon reduction targets in a selection of global cities (see video here). We have helped with staff engagement at a number of companies including Kingfisher PLC. Our design team have produced films for ECMWF to show how the Copernicus climate data services also play a critical role in enabling change (read more here).
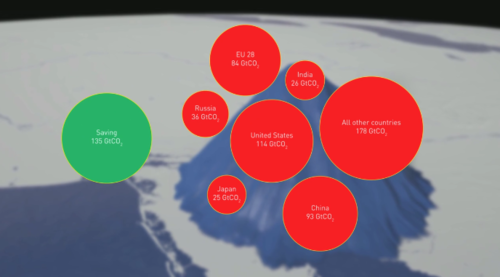
So whilst this is about showing the climate and carbon challenges it is also about visualising success and paths we can follow to meet them. We created visuals to celebrate the Montreal Protocol earlier this year. Ozone protection efforts stemming from the Montreal Protocol have significantly contributed to the mitigation of climate change by preventing more than 135 billion tonnes of carbon dioxide equivalent emissions going into the atmosphere (read more here).
There is a lot resting on COP21 but then the future starts. When you can see the difference working together makes, it can help you keep the faith in each other – the world over.
If you can see it, you can do it. Together.
A Carbon Visuals blog
A Real Bubble / Animation Combo
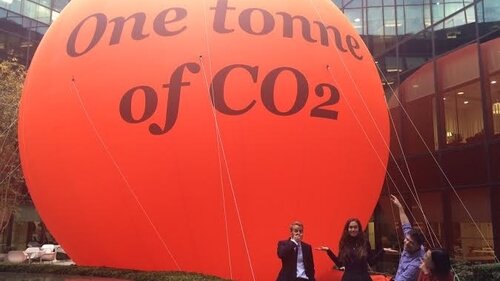
Staff at PwC UK have come in to work to see that a giant 10 metre diameter CO2 ‘bubble’ has appeared in the atrium of their London head office. In addition a complimentary 90 second film shows how the bubble arrived in this unusual setting.
If you want to get an issue noticed be bold! Staff at PwC UK have come in to work to see that a giant 10 metre diameter CO2 ‘bubble’ has appeared in the atrium of their London head office.
A well as a “mahoosive CO2 bubble” as one member of PwC staff put it on Twitter, a complimentary 90 second film shows how the bubble arrived in this unusual setting.

Timed, of course, to get attention before the COP21 climate talks get underway in Paris later this month, this combination of sculpture and film helps people see that CO2 is real and not just something abstract. It also gets across the message that PwC is serious about being part of the solution to the issue.

The animation shows the UK’s daily carbon footprint and the target reduction for 2030 and 2050.

See more Twitter images here
Timed, of course, to get attention before the COP21 climate talks get underway in Paris later this month, this combination of sculpture and film helps people see that CO2 is real and not just something abstract. It also gets across the message that PwC is serious about being part of the solution to the issue.
We love it. Wonder who made the video…
A Carbon Visuals blog