
In 2016 we changed our name from Carbon Visuals to Real World Visuals because we were increasingly being asked to create animations and image sets to depict other ‘invisibles’ like water, air quality, waste, plastic and even people in statistics. Here are examples of these projects.

Electric vehicles are at the heart of the clean energy transition. But as prices reduce and manufacturers increase their model line ups where are the raw materials needed to produce rapidly increasing volumes of EVs going to come from?

The global cement / concrete supply chain currently produces a disproportionate amount of greenhouse gas emissions. Innovative solutions that make cement and concrete production and usage sustainable are urgently needed. But how do you bring together different technology, finance and academic stakeholders to rapidly reduce those emissions?

Primary ‘old growth’ forests are unique and irreplaceable. But how do you get that message across to governments, policymakers and corporations? And the message that not all forests are the same?

Mobile phones have become a huge part of our daily lives, but what are they made of? We made an animation showing the different elements including rare earth minerals for one phone, and also in all the phones made in a year (that’s 1,475 million smartphones)

What does a pile of 60million unwanted Christmas presents look like? This image supported a campaign which called on UK shoppers to give more meaningful gifts at Christmas.
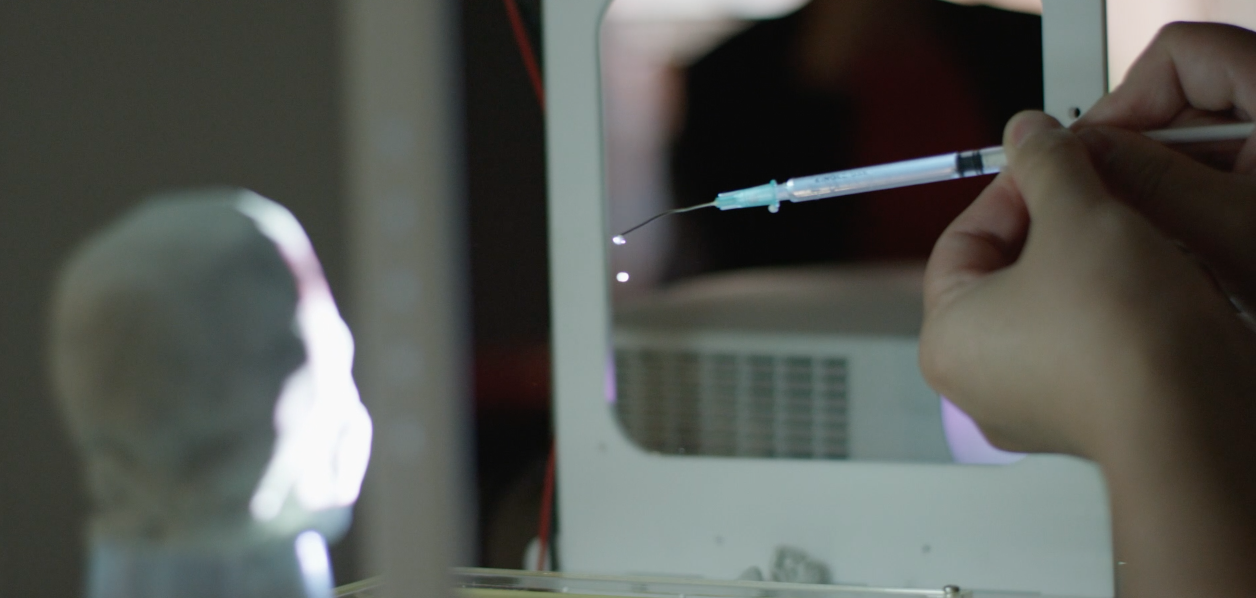
If you had a magic levitation device, what would you use it for? In this bespoke project with Sussex University we brought together artists and engineers working on an ultrasonic levitating device.

Our client wanted to show the scale of the problem of ocean plastic to an audience at the Cannes Lions Festival. So we made a film to show the rate of plastic waste in the Mediterranean Sea every second, and every day. And we liked the idea of filling the bay of Cannes with toy ducks!
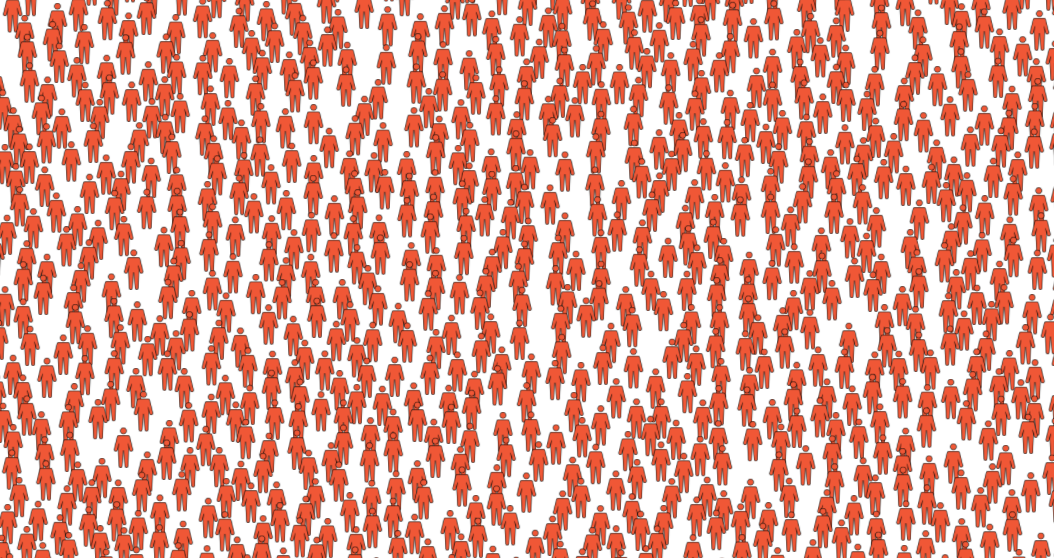
Many of us find it hard to make sense of people in statistics. So we created a ‘crowd visualisation’ tool for an NGO that allows people to explore data about their full and associate members by type of organisation, region, country, language and other characteristics in 3D and 2D.
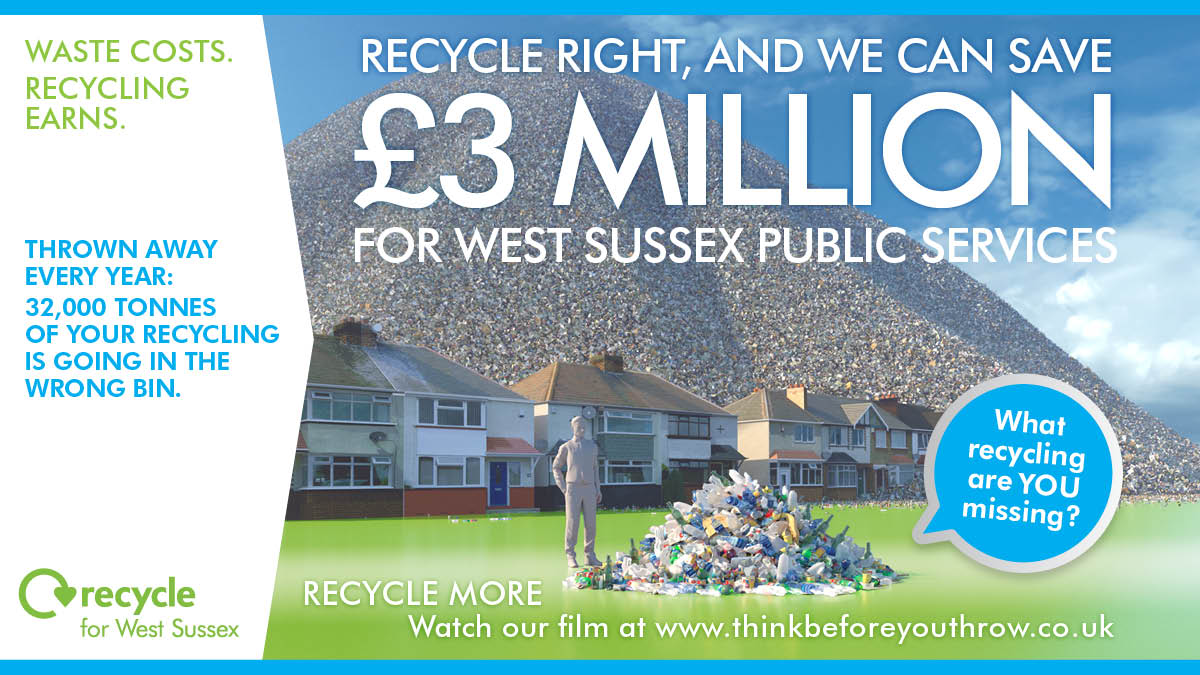
West Sussex County Council wanted to draw attention to the recycling that residents don't do, but could. We created an animation for a public engagement campaign using social media, and a range of still and print materials for bill-boards and local news advertising.

Ireland has agreed to cut carbon emissions by at least 80% by 2050, compared to 1990 levels. We provided the visual interface for a web-tool that allows anyone to access and explore different future electricity and energy supply and demand options for the country.

An unusual request from a successful USA start-up - could we find a simple way to show investors the exponential growth of their mobile phone money transactions in Mexico? Using dates and geo-location data for all transactions we created this simple short video.

Bristol Waste Company is keen to engage directly with households about the benefits of waste and litter minimisation and recycling. Real World Visuals has created two films that show the actual volumes of litter, recycling and recycling opportunities. The goal of the project is to elicit a measurable increase in waste minimisation and recycling and provide direct cost benefits to the council.
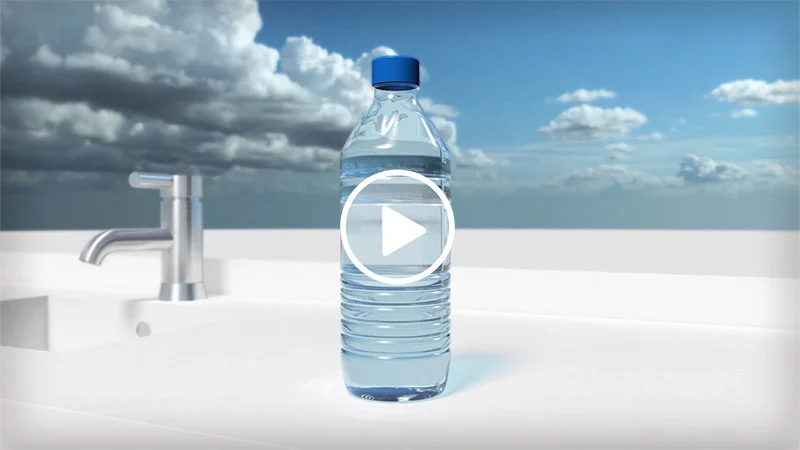
How can we make an abstract idea like 'the value of water' real? Research shows that tap water in the South West of England is typically 600 times cheaper than bottled water bought from a shop. This simple video was designed to get this message across to consumers.

How do you communicate complex services for the scientific community in ways that are not only true to the science but also make sense to a general, non-scientific audience? These two films show the services provide by Copernicus, the EU satellite monitoring programme.

We created digital campaign resources for UNEP to celebrate 30 years of international effort to protect the ozone layer. A key film highlights the dangerous global warming potential of replacement gases, and the 135 billion tonnes of CO2e that the Montreal Protocol has kept out of the atmosphere.
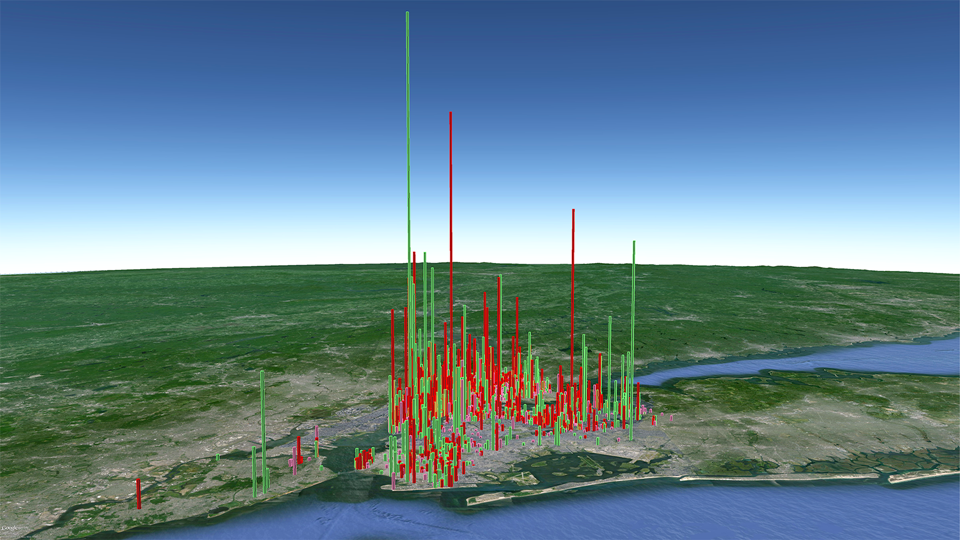
We created a set of images pinpointing the air pollution from burning heavy heating oil at 8,000 buildings in New York City. Individual images showed property managers, building co-op boards and community groups their resulting air pollution and encouraged them to make positive changes.
We often inhabit places without knowing how our activities shape the natural landscape. So map-based stories that visualise what is happening beneath our feet and in the air around us can be helpful. These two videos for Somerset Wildlife Trust are good examples.