
United States' daily contribution to global warming
In 2014, the United States added the equivalent of 6,870,000,000 metric tons of carbon dioxide to the atmosphere * (6,870 million metric tons). On average that is:
- 218 metric tons every second
- 13 thousand metric tons every minute
- 784 thousand metric tons every hour
- 18.8 million metric tons every day
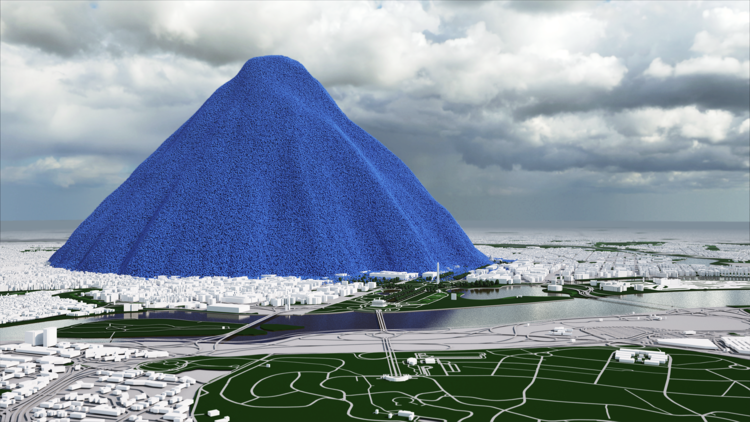
One metric ton of carbon dioxide gas would fill a sphere just over 10 metres across (33 ft) ** . To give a sense of scale to these emissions, we've made a pile of 18,809,437 one-ton spheres (US emissions for one day). The pile is 2,367 metres high (1.5 miles).


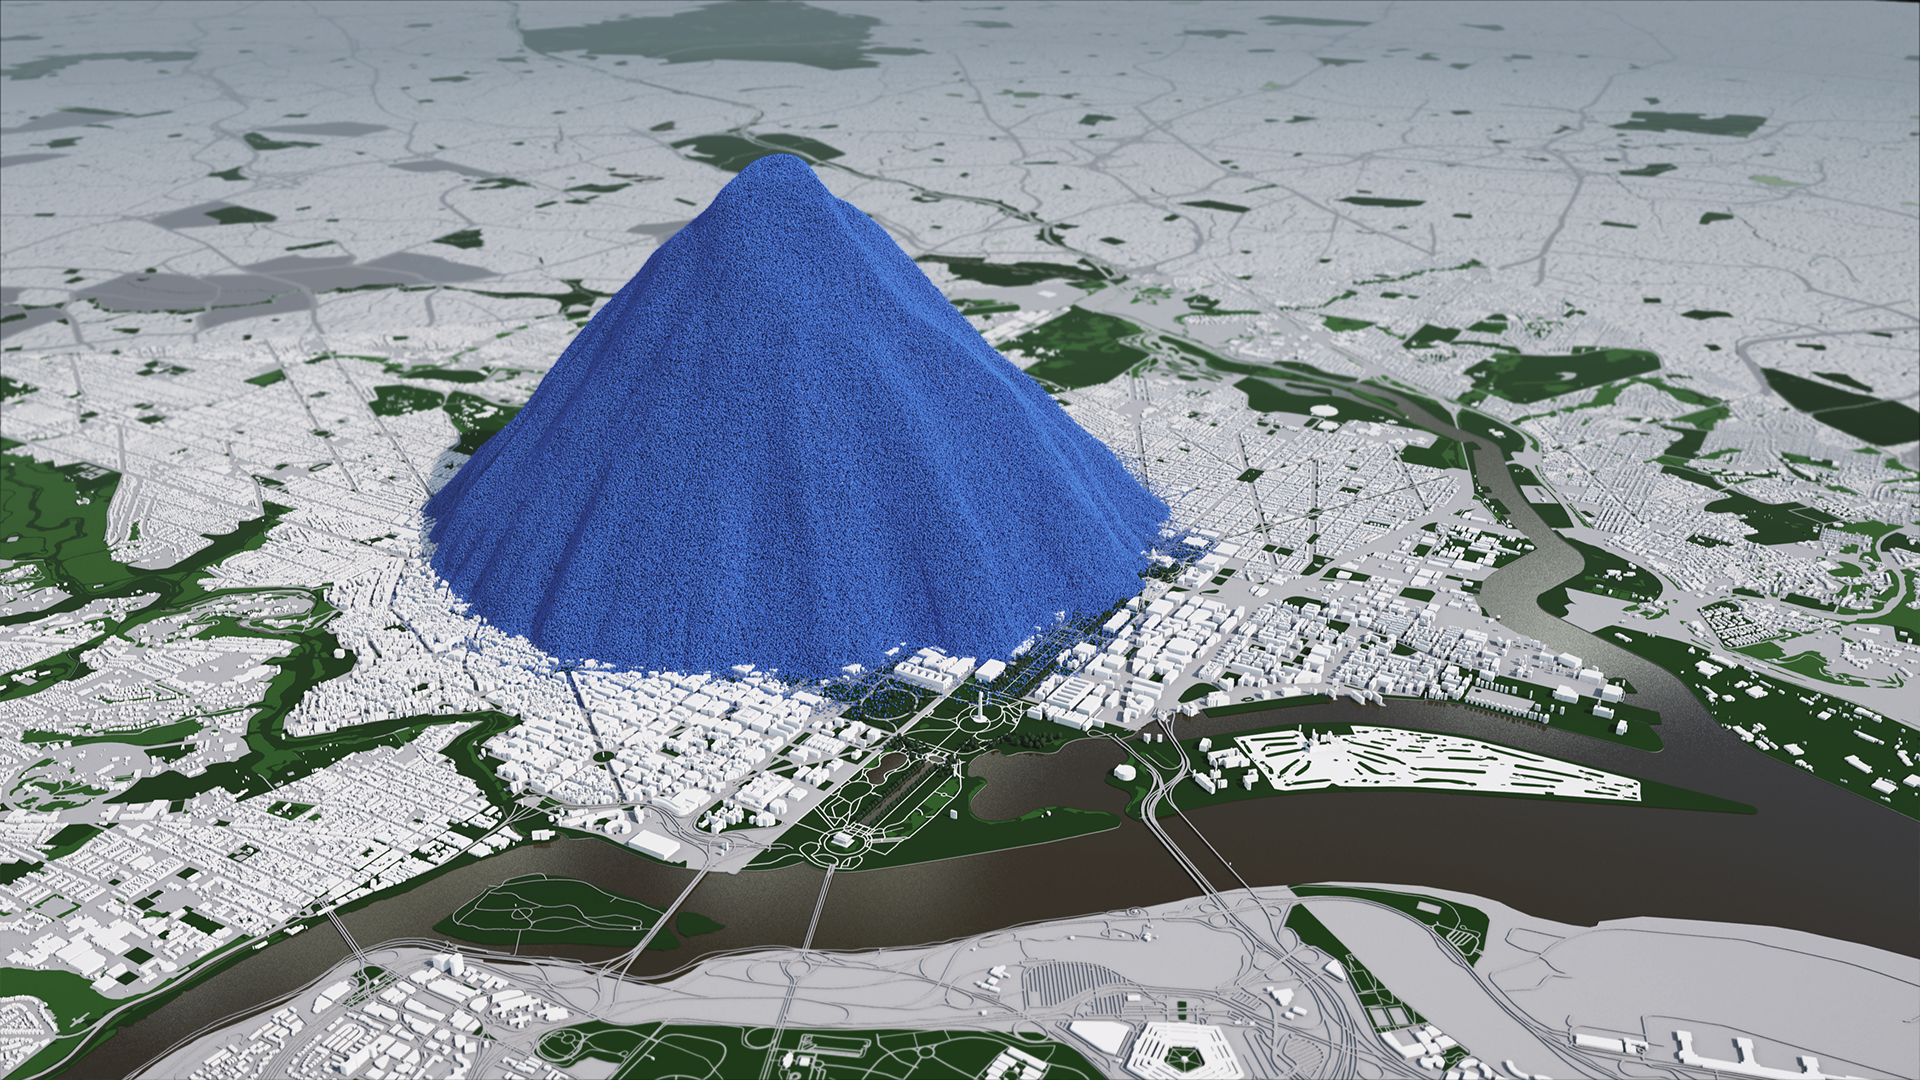
High resolution versions of these images are available with a 'Creative Commons Attribution' license from our Flickr page: US Daily CO2
To put these emissions into a global context, this image shows all the emissions from all countries in 2013. If you mouse-over the image you will see all emissions since 1750. (Note that the figures in this image are given in terms of carbon, not carbon dioxide. To convert to carbon dioxide multiply by 3.6642.)
US emissions are currently about 14% of global emissions. This film shows how much carbon dioxide the planet as a whole is adding to the atmosphere all the time.
In 2012 human activity added over 39 billion metric tons of carbon dioxide to the atmosphere, The pile of one metric ton spheres in the film, which represents one day’s global emissions, is 3.7 km high (2.3 miles) and 7.4 km across (4.6 miles).
Footnotes
* U.S. Environmental Protection Agency, 2016, Inventory of U.S. Greenhouse Gas Emissions and Sinks, Table ES-2, pp ES5-7
** At standard pressure and 15 °C (59 °F) carbon dioxide gas has a density of 1.87 kg/m3