Visualising a 90% carbon reduction
How do you demonstrate a 90% carbon reduction? We provided a short animation to show this impressive 90% achievement at the European manufacturing facility of Interface, the carpet tile manufacturer and pioneer in corporate sustainability.
A Carbon Visuals Project
CLIENT
Interface
PURPOSE
To show the 90% carbon reduction achieved since 1996 at the European manufacturing facility in the Netherlands.
DESCRIPTION
Short animation that can be used on social media together with before and after images showing the Scherpenzeel factory and surroundings with the dramatic reduction in emissions.
“In the past three years we have taken huge strides towards our Mission Zero goal.
To put it in context, we are now operating our European factories with a 90% reduction in greenhouse gas emissions compared to 1996 while the EU Commission has set an EU carbon reduction target of 40% by 2030.”
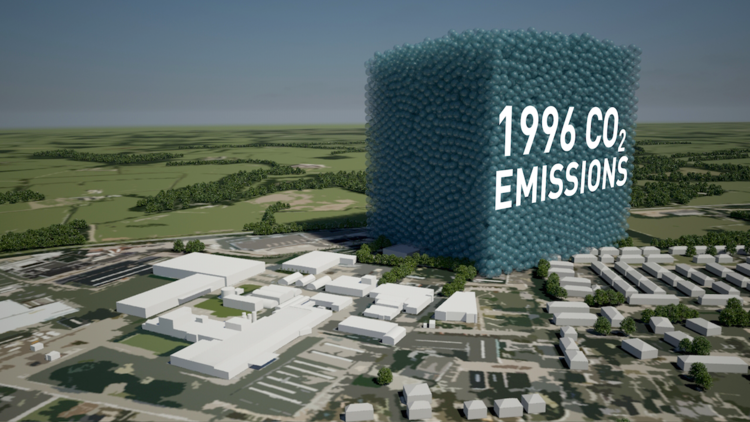
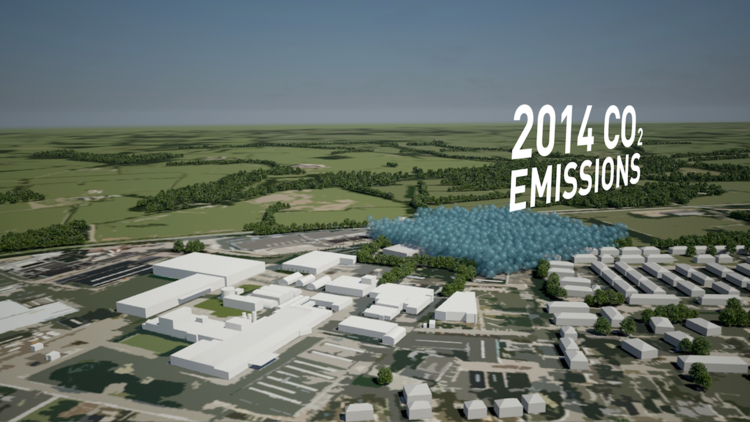
Carbon Visuals has helped Interface, the carpet tile manufacturer and pioneer in corporate sustainability, show the impressive 90% carbon reduction achieved since 1996 at its European manufacturing facility in the Netherlands.
We created a 3D model of the Scherpenzeel factory and surrounding area and populated it with our trademark ‘carbon bubbles’. Deliverables included volumetrically accurate ‘before’ and ‘after’ images as well as a short animation that can be used on social media or as part of a longer video.
Interface info on achieving 90 carbon reduction
Infographic illustrating how the emissions reduction has been achieved.
Video: A better way - Interface Europe achieves 90% CO2 reduction
Illustrating the world’s first Carbon Neutral Engine Oil
How do you visualise carbon offsetting for a consumer product? This animation was created to demonstrate that although the amount of CO2 offset for a single one litre pack of engine oil might be small, it adds up. Particularly when seen from the point of view of a whole country, or indeed world sales.
A Carbon Visuals Project
CLIENT
Castrol Professional, undertaken by Carbon Visuals
PURPOSE
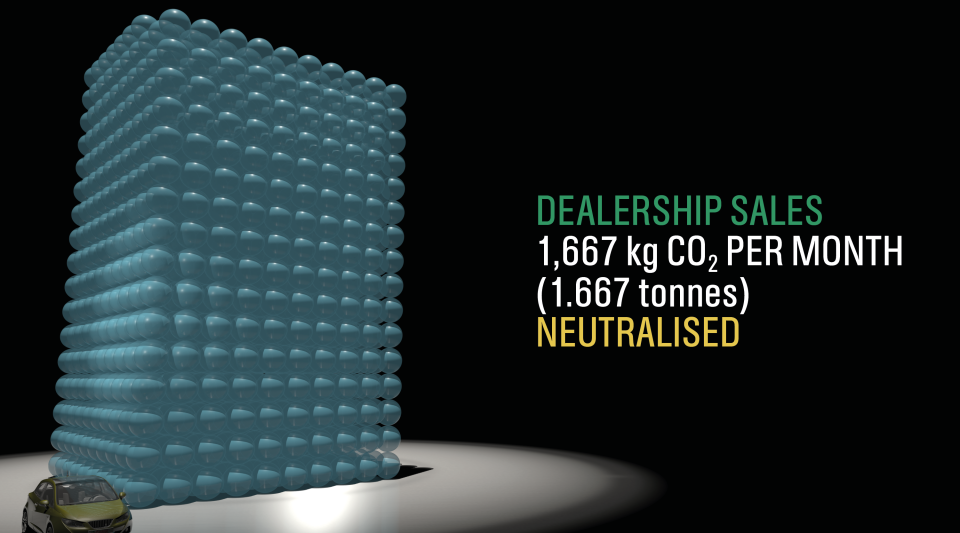
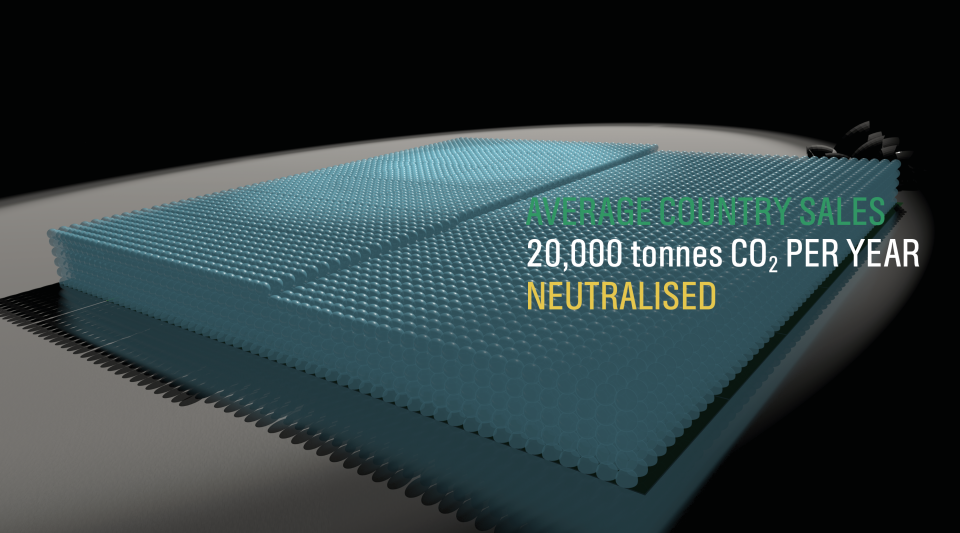
To help their dealers understand that although the amount of CO2 offset for a single one litre pack of engine oil might be small (2 kg), it adds up. Particularly when seen from the point of view of a whole country, or indeed world sales.
DESCRIPTION
An animated film for the European dealer launch at CERN in Switzerland of ‘the world’s first CO2 Neutral Engine Oil’.
A resounding success - thank you for turning this round so quickly. We are very happy with the final product and it was well received last week at CERN.
Adrian Pask, Global OEM Offer Development Manager Castrol Professional
How do you visualise carbon offsetting? This is, after all, carbon removed from the air to mitigate actual emissions. That was the challenge facing us when asked by Castrol Professional to create an animated film for the European dealer launch at CERN in Switzerland of ‘the world’s first CO2 Neutral Engine Oil’.
Castrol wanted a way to help their dealers understand that although the amount of CO2 offset for a single one litre pack of engine oil might be small (2 kg), it adds up. Particularly when seen from the point of view of a whole country, or indeed world sales.
Rather than showing the CO2 emitted in the manufacture of a consumer product, our role was to show that Castrol ‘neutralised’ those emissions. We set about writing and developing a story-board that could be animated in record time (we had less than a month to complete the project).
Background
Castrol Professional products have become the first CO2 neutral engine oils in Europe. EDGE Professional, MAGNATEC Professional and GTX Professional have all been certified CO2 neutral according to BSI PAS2060, a standard for measuring and managing the CO2 footprint of a product’s life cycle.
The company underpins its CO2 neutral claims with good science including reduction in the manufacturing process. It offsets the remaining CO2 by investing in a portfolio of emission reduction projects such as reforestation in Kenya, clean electricity generation in China and wind farms in New Caledonia.
In 2014, 200,000 tonnes of CO2 are likely to be neutralised globally by Castrol Professional. This figure is expected to grow to nearly half a million tonnes annually the following year.
More on Castrol Professional
More on CO2 reduction projects being supported by Castrol Professional
Tackling CO2 emissions is a major issue for the automotive industry globally and Castrol Professional has made this a central part of our working relationship with manufacturers and dealers, as we develop ever-more sophisticated engine oil formulations.
This is a practical step towards a longer commitment to innovate sustainably through continued technological and scientific advancement.
John Ward-Zinski, Global Brand Director Castrol Professional
To cover so many visualisations in 90 seconds with a strong product focus was potentially a tall order. Looping our narrative through a virtual world within the pack itself encourages viewers to explore and re-explore this complex story.
Dave Forman, Project Manager / Designer Carbon Visuals
The brevity and directness of this film gives staff, dealers and consumers an easy and quick feel for the product and emissions saved on a range of scales from a litre to half a million tonnes.
Antony Turner, CEO Carbon Visuals