
New York carbon footprint - five years on
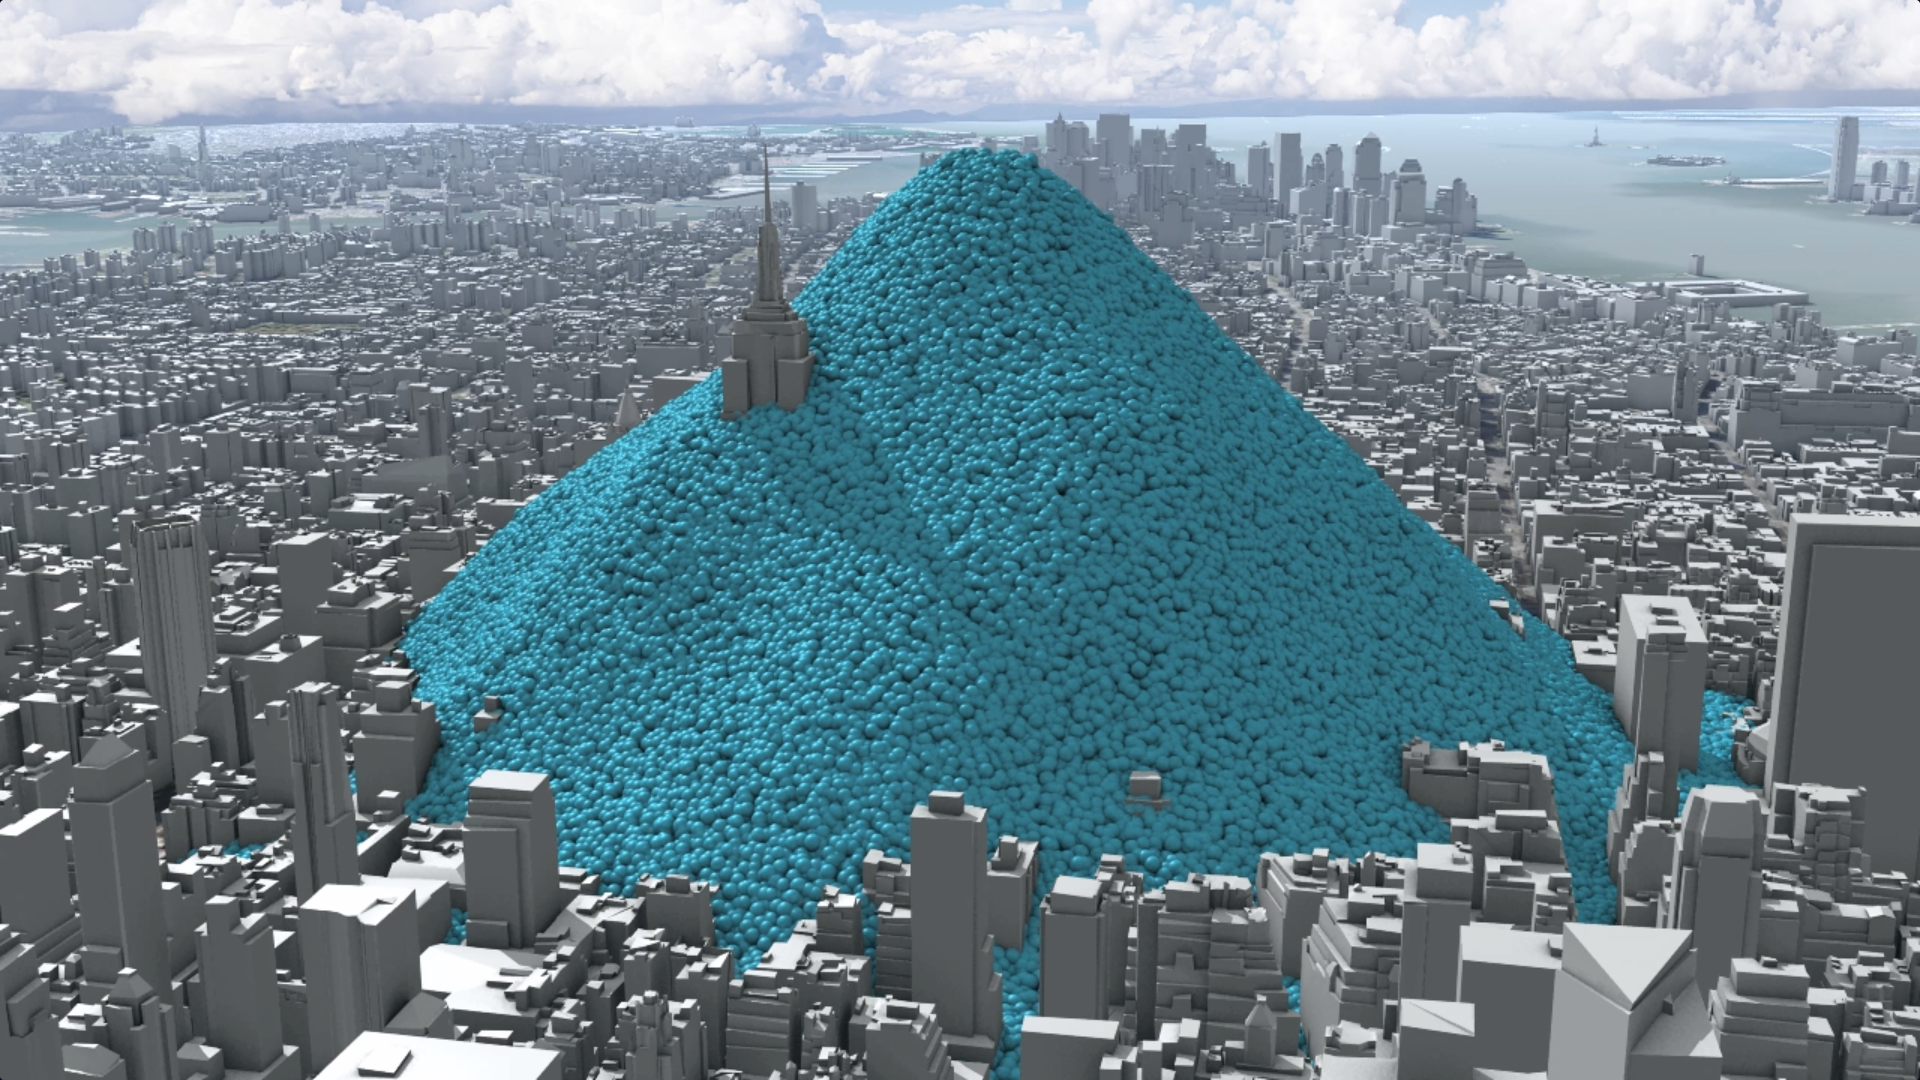
In 2010 New York City added 54 million metric tons of carbon dioxide (equivalent) to the atmosphere. This image shows the daily emissions - 148,903 tons a day
The recent cluster of hurricanes seem to count against the optimists’ hope that it’s an ill wind that blows no-one any good. Nonetheless, a hurricane hitting the USA five years ago helped an experimental film with a New York City backdrop go global.
Our trial three minute animated film showing the carbon emissions of New York City was unveiled in October 2012. The film was part of work commissioned by the Environmental Defense Fund to see if our techniques could help the US public to a better understanding of carbon emissions, the primary cause of climate change.
A few weeks later Hurricane Sandy hit New York City. We were bombarded by requests to use the video. In the next few months it appeared on the web pages of over 100 media organisations including Scientific American, Mashable and New Scientist. We even featured in the Daily Mail Online, a site not usually associated with useful information on climate change.

In fact, the film does not mention climate change. It is simple, and non-judgmental. It just says: this is what 54 million tonnes of carbon dioxide would look like if it wasn’t invisible. There’s no proselytising - just data-visualisation using an iconic approach to demonstrate scale – a movie -style intro to the streets of New York City, which pretty well everyone can relate to.
The film won a clutch of awards - the Silver Prize in the Information is Beautiful Awards in London, an award from the American Clean Skies Foundation, The Energy Vision Prize in Washington DC ,and stills appeared in The Best American Infographics 2013. It brought Carbon Visuals (as we were then called) global recognition. Commissions to create more films included one for the UN Ozone Secretariat. New York and the United Nations building became a favourite location and scaling device.

Our Creative Director, and Producer and co-Director of the winning film, Adam Nieman attending the Information is Beautiful Awards in London, 2013.

And the idea evolves... Real time global emissions (set in New York), an extract from a film for the World Business Council for Sustainable Development.
Our creative style has evolved, but we maintain the key techniques of the New York Video in much of our work, including short video, GIFs and interactives designed for sharing on social media.
Five years on, we’re in hurricane season again with a vengeance. The need for seeing what is invisible in this story of our climate is more acute than ever before.