
How do you visualise climate reparations? That was the question we were asked last year by the Climate Accountability Institute who were investigating potential annual reparations to compensate those communities around the world most damaged by climate change. The calls for climate reparations are rapidly growing in the scientific literature, among climate movements, and in the policy debate. At present the costs of climate change are primarily borne by nation states that compensate their own citizens harmed by climate impacts or covered by insurance companies with regard to people and businesses that they insure. Some countries are also now promising to contribute to the Loss and Damage Fund agreed at COP28 to compensate people in low income countries.
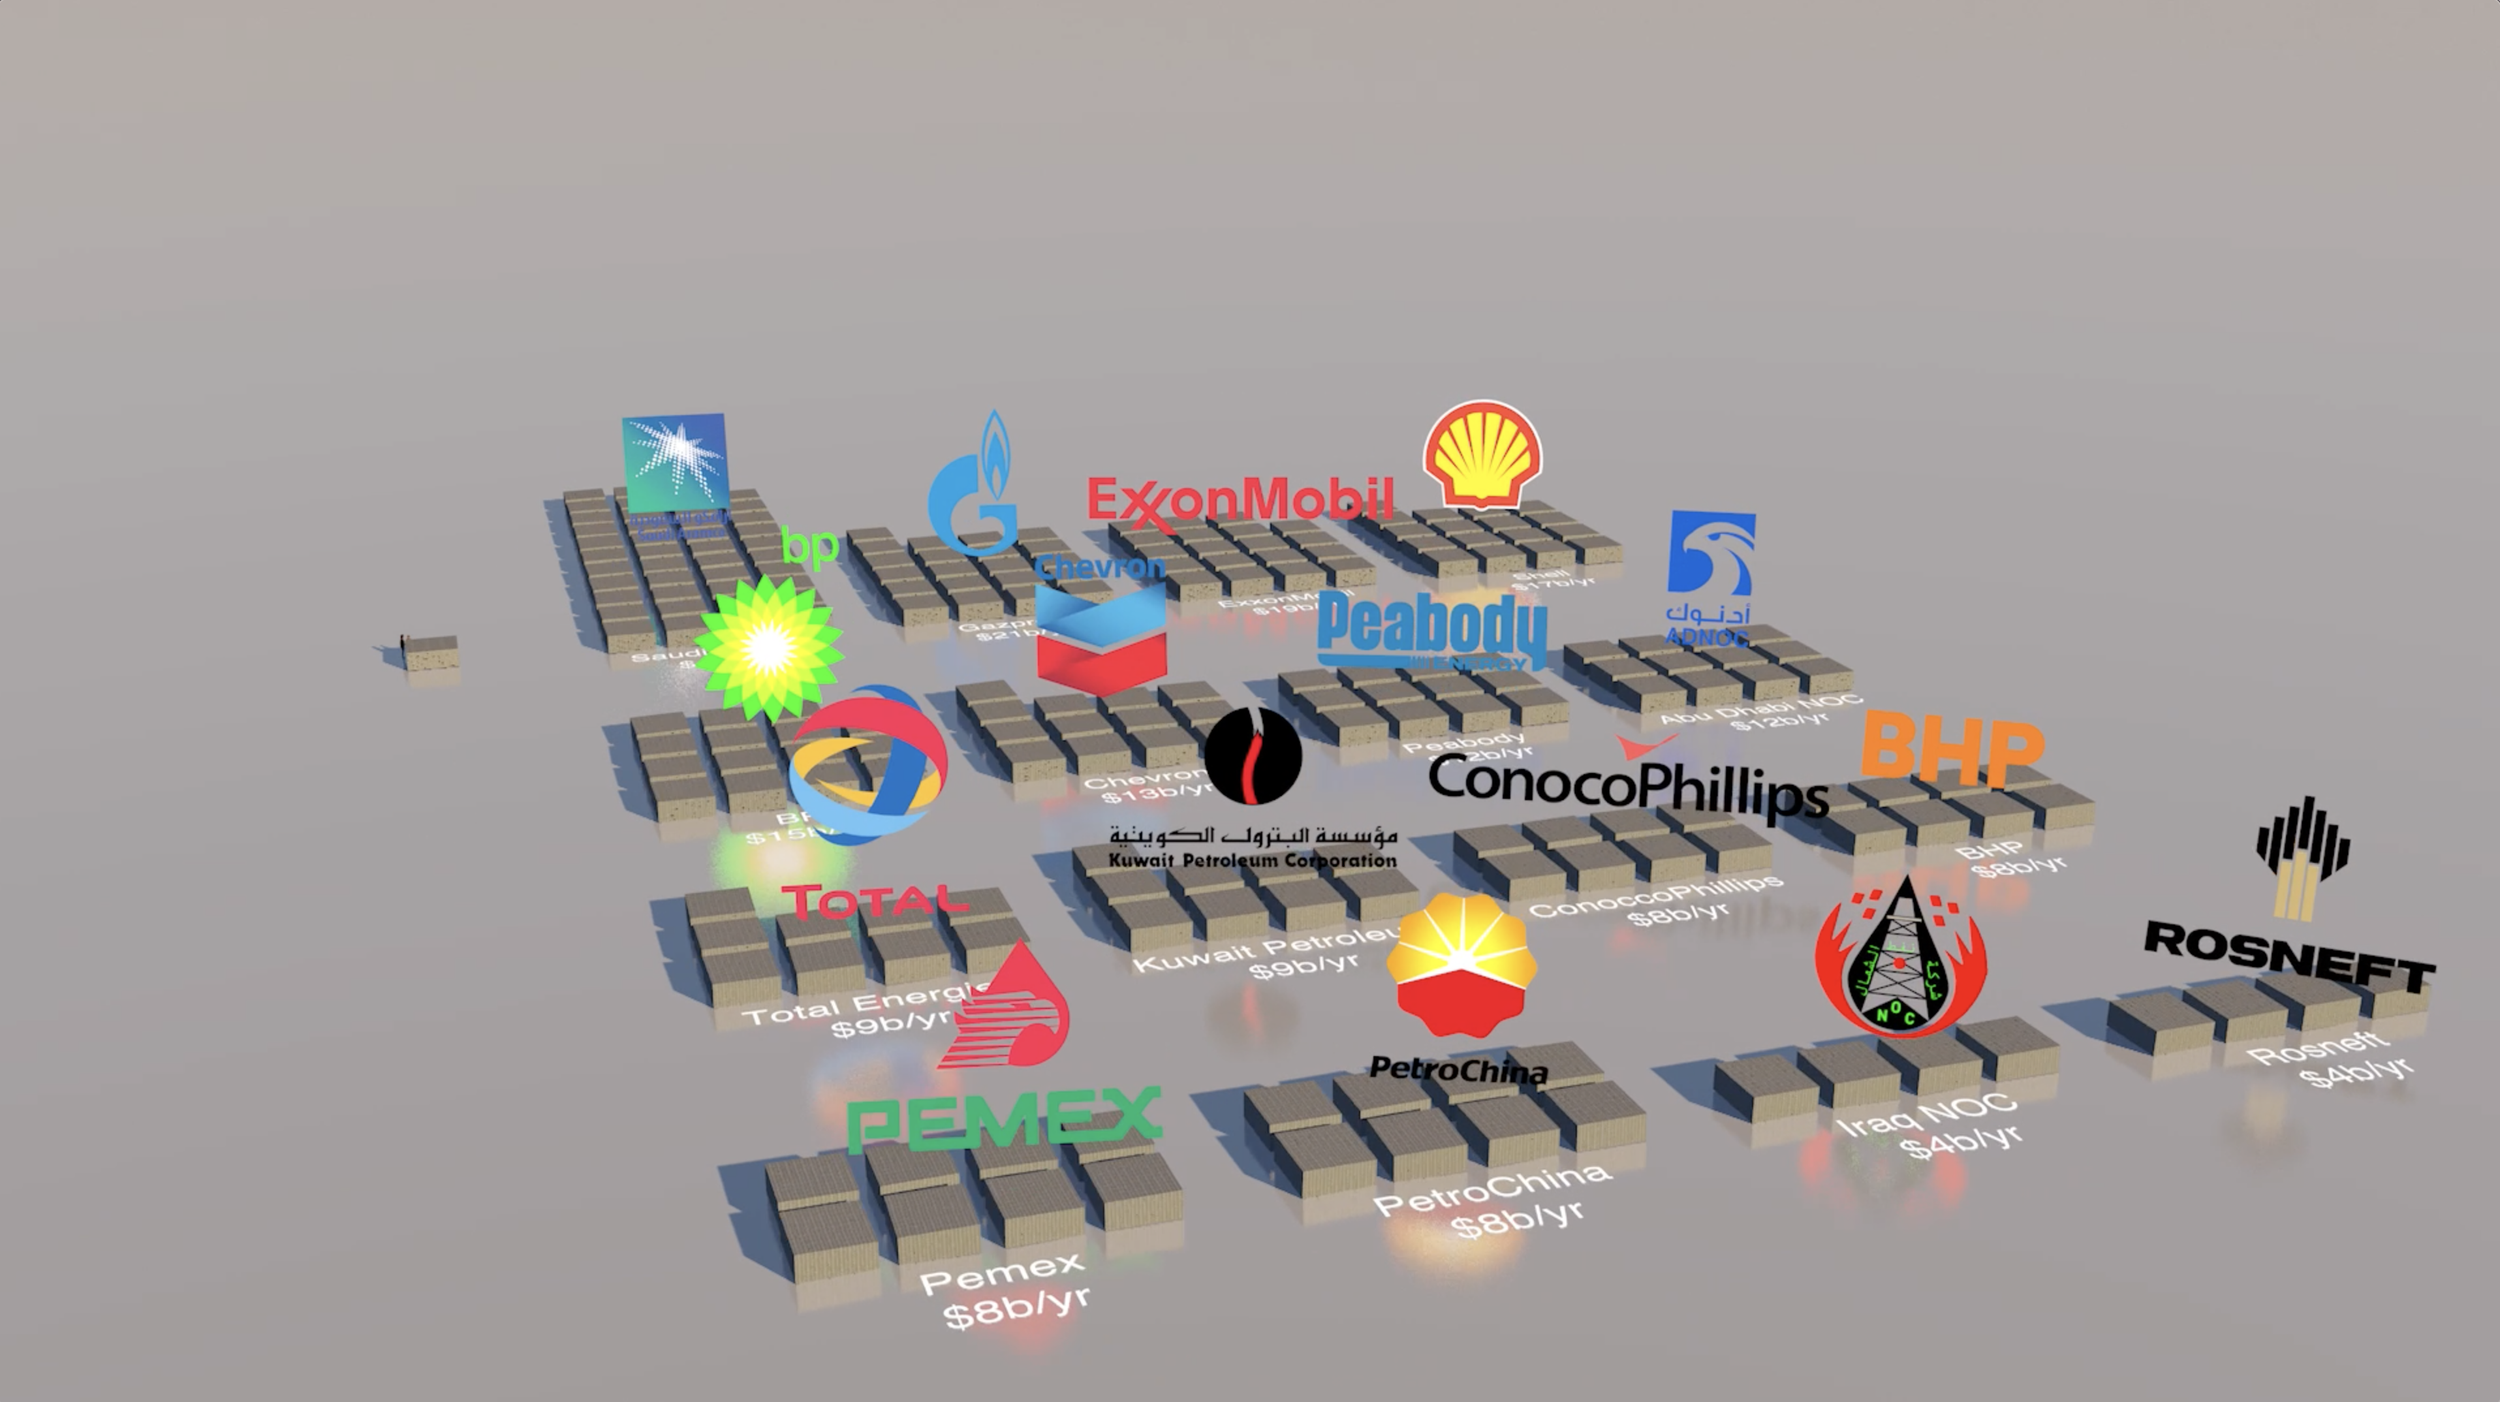
“Time to pay the piper: Fossil fuel companies’ reparations for climate damages” argues that a substantial responsibility for the cost of redressing climate harm lies with the companies that engage in the exploration, production, refining and distribution of oil, gas and coal. The opportunity to help communicate this story was quite a challenge, but we created a simple image based on the data in the Paper. However recently we have been wondering whether the $209 billion dollars attributed to fossil fuel companies could be better illustrated by a CGI animation. This is the result.
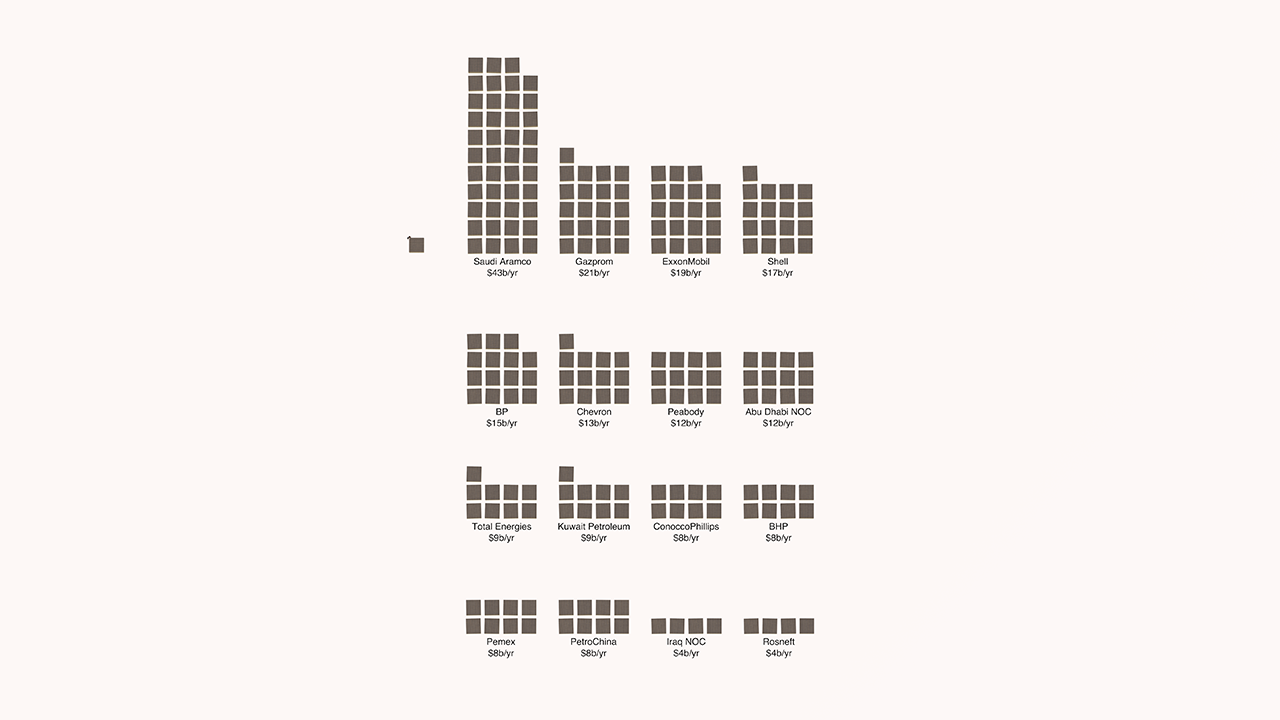
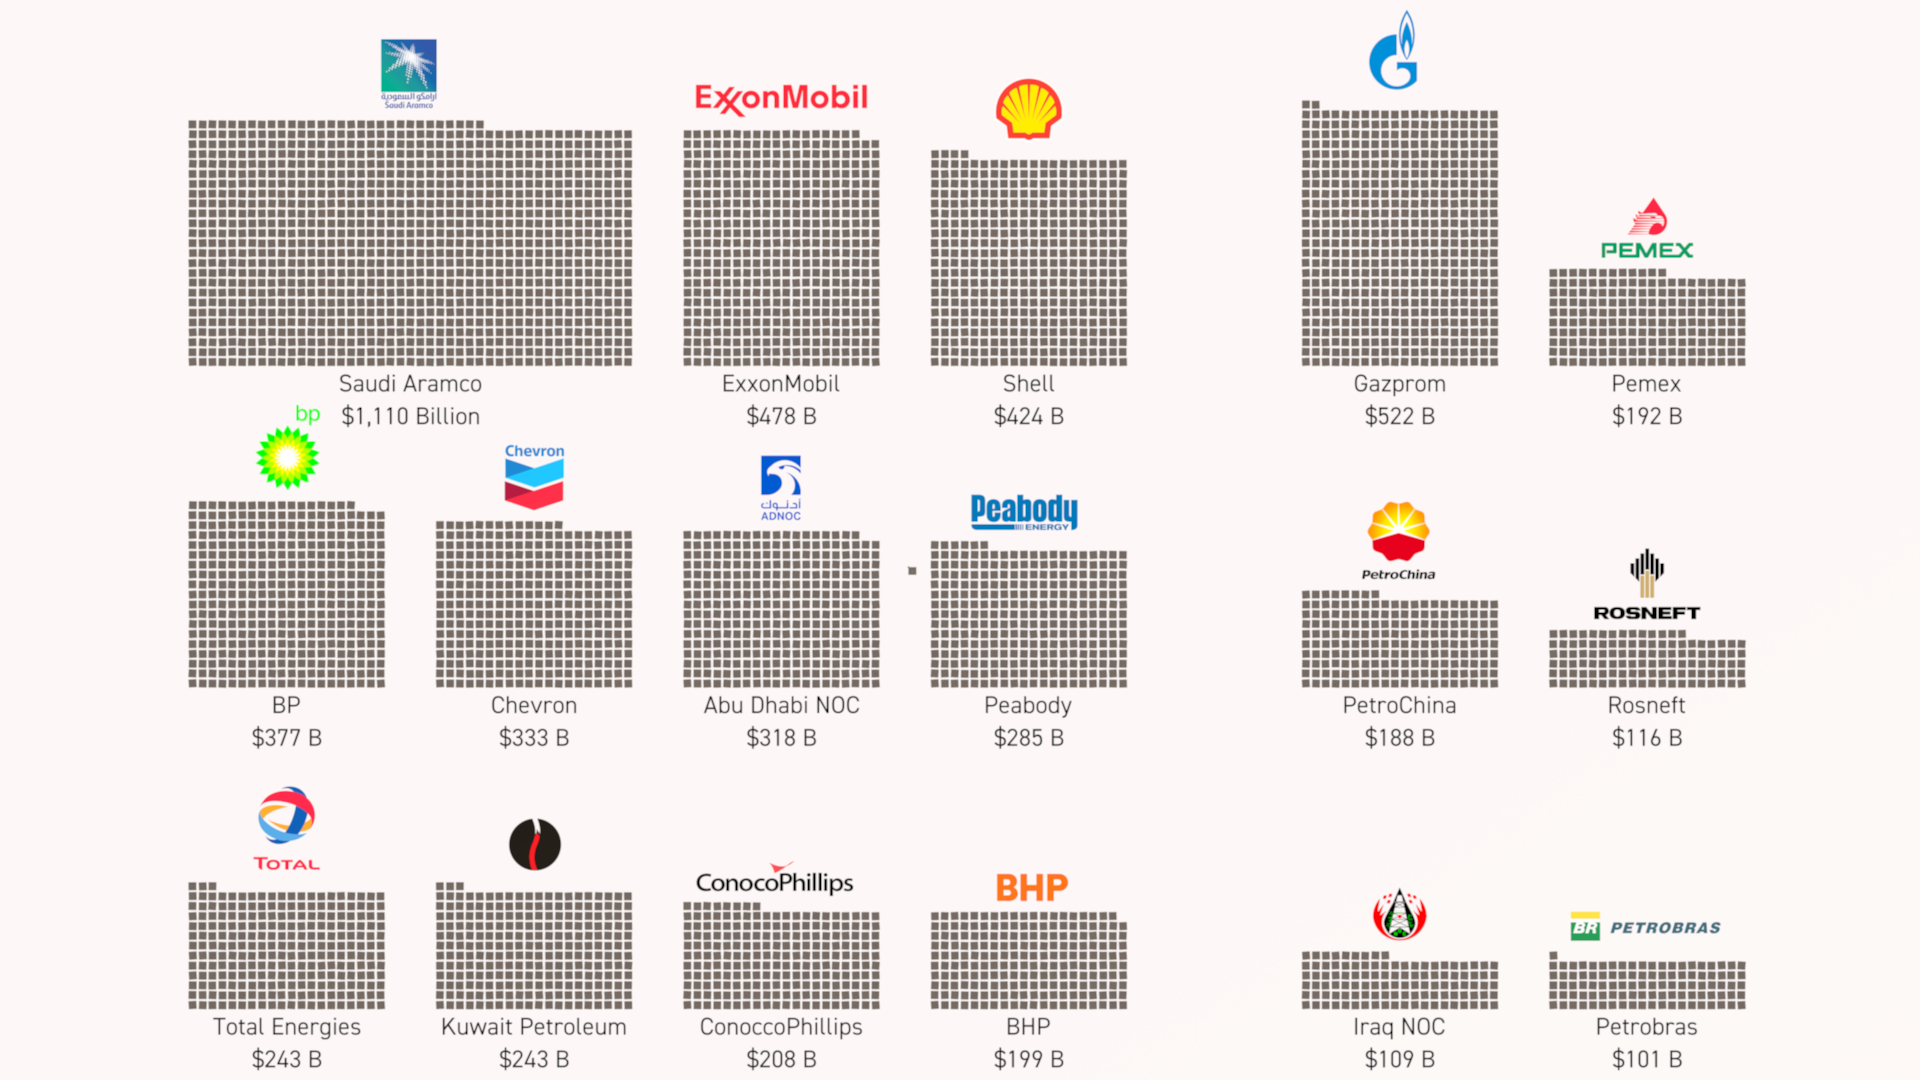
Two perspectives on annual reparations (each block is a $billion)
This is the simple abstract image we created for the Report’s Press Release. Each square represents a billion dollars.
“As increasingly devastating storms, floods and sea level rise bring misery to millions of people every day, questions around reparations have come to the fore.
”
Finally we thought it could be useful to create a simple version just showing what $1 billion looks like (in $100 dollar bills)
Real World Visuals is best known for creating images and animations depicting carbon dioxide emissions, savings and targets. But we have also created visuals to show a variety of ‘invisible’ challenges including air pollution, ozone, water quantities, raw materials and even unwanted Christmas gifts.
Contact us if you have a challenge communicating billions of dollars or billions of tons!